Open the TC2 file before the cycle is finished. Broken nodes are already visible. So are waiting corridors and source records that can move the map. The June Phase II package is the first near-term score event inside a longer live-cycle call.
The base universe is public enough to score. Phase I put 450 requests, 354 point of interconnection (POI) / substation clusters, and 27 corridor profiles into view. The status overlay separates live, terminal, and impaired projects before the final survivor count exists. PJM's January cycle schedule says the Phase II package is expected to cover 270 studied projects plus 8 accelerated-to-final-agreement projects.
An infra fund or power investor can use the map to screen price and timing exposure. A platform owner, developer, or load buyer can see which corridor deserves work before the next PJM posting. The screen narrows the diligence file before Phase II changes the evidence set.
The completed-cycle survivor count comes later. The live file already shows where risk is forming, which nodes deserve first diligence, and which June rows should prove whether the physical story is right. Reinforcement and constraint families hold the proof. Corridors and POI/substation clusters hold the underwriting read. Project rows stay in the controlled file so the corridor map can be scored without becoming a project-ID dump.
TC1 showed the mechanism after the cycle finished. Actual cost letters and schedule exposure sorted the cohort under withdrawal pressure. TC2 is the live version. The bottom-up work starts with project rows and POI clusters, then follows reinforcement families through cost channels as construction clocks and later status changes land. The pages below move through that map. The support package preserves the audit trail behind it.
Three TC2 facts are already public enough to matter before Phase II. Terminal and impaired statuses cluster around particular corridors and nodes. Several stressed nodes have already moved from generic queue risk into specific exposure surfaces. Pierce Brook-Lewis Run, Greentown/Marysville, and the Dominion backbone family now belong in the live diligence file. ComEd diverges from a simple clock model, which makes the exception useful.
Start with the visible collapse, then test waiting risk against new-build burden and the ComEd exception. That order keeps the live read tied to public behavior before the June cost file arrives. Phase II and later status records will decide which parts survive.
PJM's January cycle schedule says TC2 Phase II SIS reports are anticipated on June 1, 2026. It also says the package should cover 270 studied projects plus 8 projects accelerated to final agreement. That 270 plus 8 frame is the denominator anchor. If the posted package materially differs, the map gets rebased before any corridor call is scored.
Phase II has a different job from the completed-cycle scorecard. It asks whether the map pointed at the right physical objects. It checks the cost channel, the row family, and the corridor or POI split. Terminal attrition after developers read cost detail is scored through a later project-status snapshot or the completed-cycle materials.
The following checkpoint calls clear the 85% promotion bar. The confidence bands are judgment bands built from source trace strength and denominator stability. They also reflect Phase II scoring fit and the counterfactuals that would break the call.
| Checkpoint | Public call | Score event | Failure test | Confidence band | Why this is above the bar |
|---|---|---|---|---|---|
| P2-1 | System-reliability network-upgrade exposure remains the largest cost channel in at least four of the six public corridors. | PJM TC2 Phase II network-cost summary, grouped to the R3 corridor map. | System-reliability network-upgrade exposure is not the largest cost channel in at least three public R3 corridors. | 89% (85-93%) | Current live-project baseline has system-reliability upgrade exposure as the largest channel in all six public corridors, and the threshold allows two corridors to break after restudy. |
| P2-2 | At least three of four Dominion backbone families remain as non-eliminated or traceable successor rows with cost or schedule attached. | PJM TC2 Phase II load-flow, topology-changing, and eliminated-reinforcement tables. | Fewer than three of the four frozen Dominion backbone families persist under a conservative same-endpoint or same-line-family rule. | 90% (86-94%) | The four families are large physical line projects, two have confirmed recycled lineage, and the threshold allows one family to disappear. |
| P2-3 | MAIT Pennsylvania enters Phase II with no more than 15 studied or accelerated projects, and Pierce Brook-Lewis Run remains absent. | PJM TC2 Phase II project list, checked against the R3 POI/substation cluster denominator. | MAIT has more than 15 studied or accelerated projects, or any Pierce Brook-Lewis Run project appears in the studied or accelerated cohort. | 97% (95-99%) | Current baseline is 13 live projects in the corridor, and Pierce Brook-Lewis Run is already 8 terminal out of 8. |
| P2-4 | The AEP Greentown split survives: Jefferson-Greentown and Dumont-Greentown remain absent; Marysville-Flatlick keeps at least two of three. | PJM TC2 Phase II project list, checked against the 12-POI Greentown frame. | Jefferson-Greentown or Dumont-Greentown reappears, or Marysville-Flatlick falls below two studied or accelerated projects. | 94% (90-97%) | The current 12-POI frame is sharply split: 9 terminal projects at Jefferson/Dumont and 3 live projects at Marysville-Flatlick. |
| P2-5 | ComEd remains the live exception: CE Illinois keeps at least 25 of 36 projects, and Nelson-Electric Junction keeps at least three of four. | PJM TC2 Phase II project list, checked against the R3 corridor and POI/substation denominators. | CE Illinois falls below 25 studied or accelerated projects, or Nelson-Electric Junction falls below three of four. | 90% (86-94%) | Current baseline is 29 live projects in CE Illinois and 4 live projects at Nelson-Electric Junction; the threshold allows several additional losses. |
The Dominion checkpoint freezes the row families before Phase II posts. A successor counts only if it preserves the same endpoints or same line family and still has cost or schedule attached. Vague planning language fails the checkpoint.
| Frozen Dominion family | What Phase II must preserve |
|---|---|
| North Anna-Midlothian new line | Non-eliminated row or conservative successor row with cost or schedule attached |
| North Anna-Midlothian rebuild | Non-eliminated row or conservative successor row with cost or schedule attached |
| Midlothian-Carson line 563 rebuild | Non-eliminated row or conservative successor row with cost or schedule attached |
| Midlothian-Carson new line | Non-eliminated row or conservative successor row with cost or schedule attached |
The MAIT and AEP checkpoints are continuity checks with high confidence because the current public record already shows the relevant node facts. The system-upgrade and Dominion checks are larger commercial claims. ComEd is the symmetry check. If ComEd breaks early, the clock thesis gets stronger and its standalone explanatory value falls. If ComEd survives, the model has to keep explaining the exception.
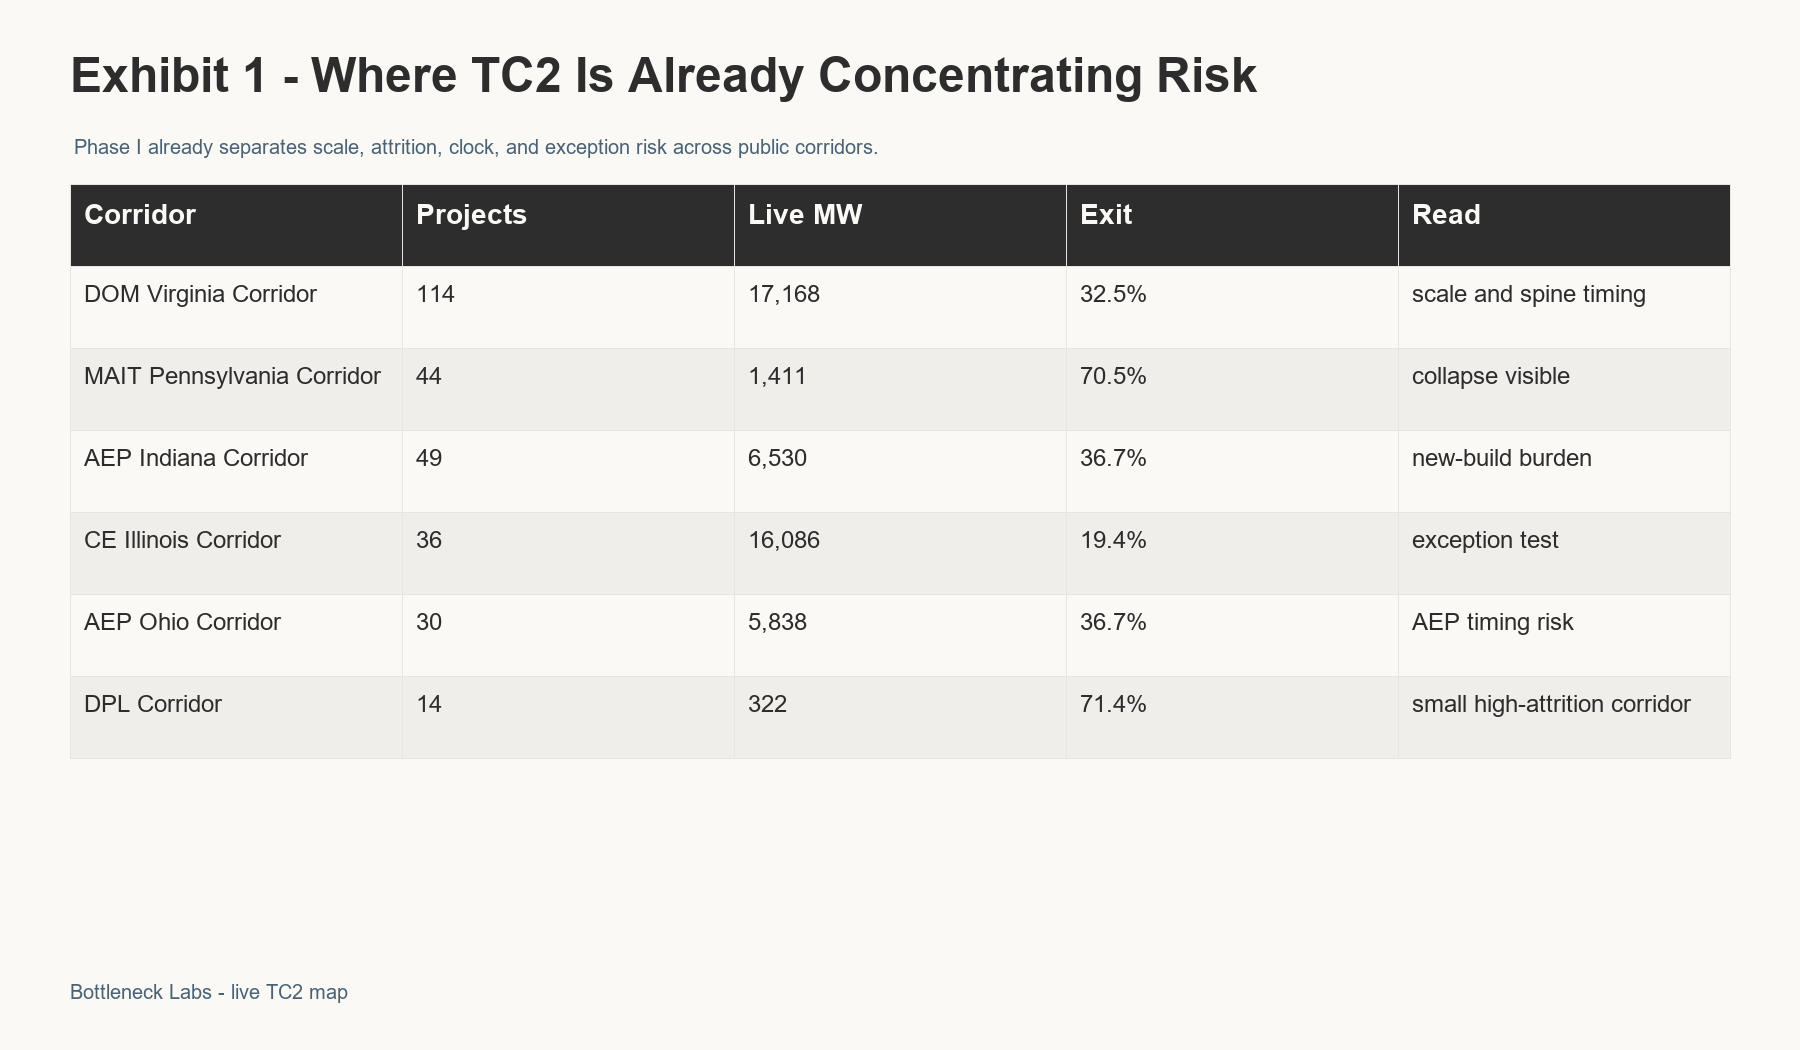
| Corridor | Projects | Live MW | Exit | Impaired-live | Clock | First diligence question |
|---|---|---|---|---|---|---|
| DOM Virginia Corridor | 114 | 17,168 | 32.5% | 25.4% | 39 mo | which live projects are delayed-attrition candidates when Phase II cost detail lands? |
| MAIT Pennsylvania Corridor | 44 | 1,411 | 70.5% | 65.9% | 63 mo | which accounts already have terminal or impaired exposure, and which still face delay risk? |
| AEP Indiana Corridor | 49 | 6,530 | 36.7% | 18.4% | 84 mo | which projects sit on Greentown/Marysville exposure, and is the 12-POI or 16-allocated frame the right lens? |
| CE Illinois Corridor | 36 | 16,086 | 19.4% | 44.4% | 84 mo | is this a resilient local regime or a delayed catch-down against the clock? |
| AEP Ohio Corridor | 30 | 5,838 | 36.7% | 13.3% | 54 mo | which AEP timing exposures deserve a second-order watchlist? |
| DPL Corridor | 14 | 322 | 71.4% | 42.9% | 30 mo | is the remaining live set small enough to monitor project by project? |
Queue-wide averages hide the operating unit. A project can look similar on technology and sponsor quality and still face a different outcome because it sits on a different node, shares a different upgrade, or waits on a different construction clock. Use the corridor and node row. It ties the grid entry point and upgrade family to neighbor attrition and the clock column.
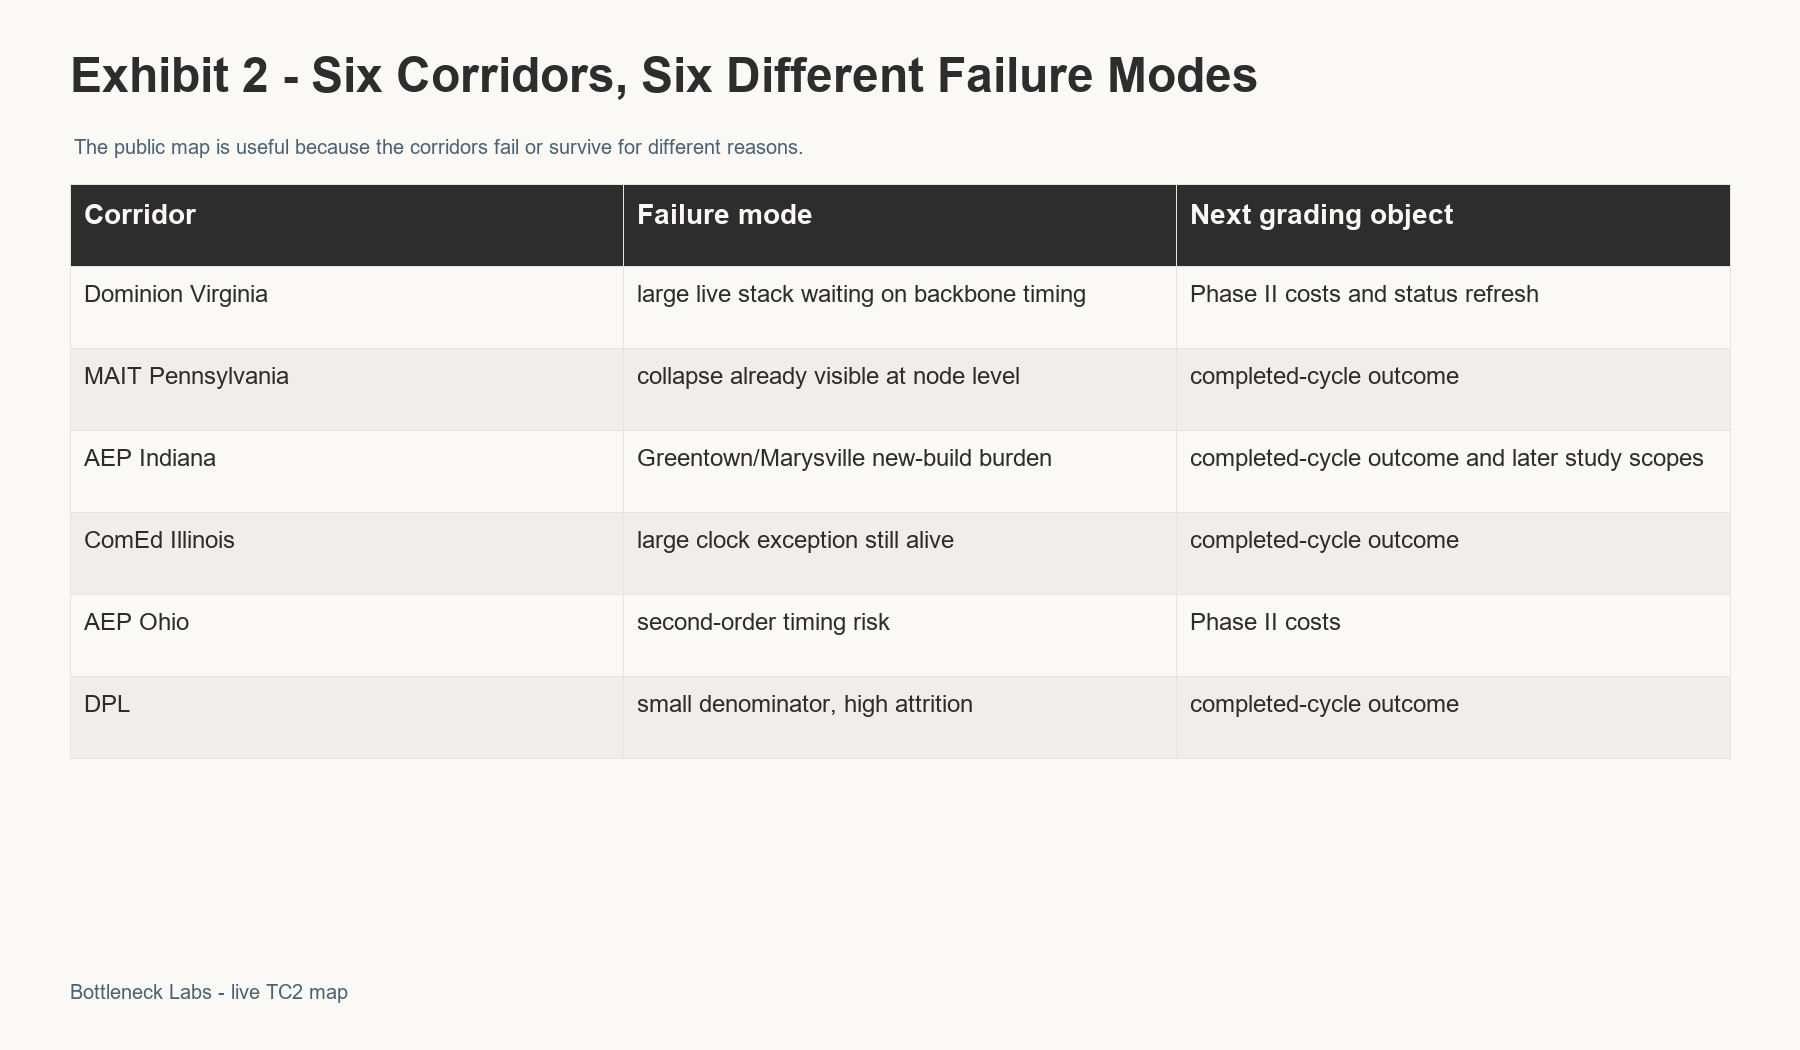
Dominion's live stack is the scale problem. It has 114 projects and more than 17 GW of live MW against a spine horizon that reaches 75 months. MAIT is the already-visible collapse surface. AEP Indiana has the Greentown/Marysville burden, where the evidence supports a TC2 new-build exposure reading. ComEd has a severe paper clock with a low mid-cycle exit rate so far.
Phase I leaves the completed-cycle outcome open. It still tells diligence where to start. Phase II costs and completed-cycle materials will decide more of the outcome. The first-order shape is already visible, and the next PJM document has specific corridors to grade.
The first underwriting memo can change before the final survivor count exists. Locate the project. Identify the upgrade family that sets the clock. Then ask whether exposure is local, shared, or dependent on a future PJM row. That is enough to change a term-sheet conversation.
Dominion projects need a delayed-attrition file, because the current status record can make the corridor look calmer than the backbone clock suggests. Greentown/Marysville projects need allocation-row scrutiny, because the corridor map and the cost-causality file are separate objects. ComEd projects should be held as exceptions until the next record decides whether the severe clock is being neutralized by local regime, project mix, threshold elimination, or sponsor quality.
The next account memo can ask which projects sit behind the exposed clusters and which accounts own the exposure. From there, private diligence can trace sponsor, customer, or portfolio exposure under a separate source gate. That step bridges the corridor read to the deeper account file.
The verdict stays open until the next PJM source object lands. Phase II tests whether corridor pressure maps to cost channels and reinforcement families. Later status snapshots test whether the cost detail changed project behavior. Completed-cycle materials decide the survivor result.
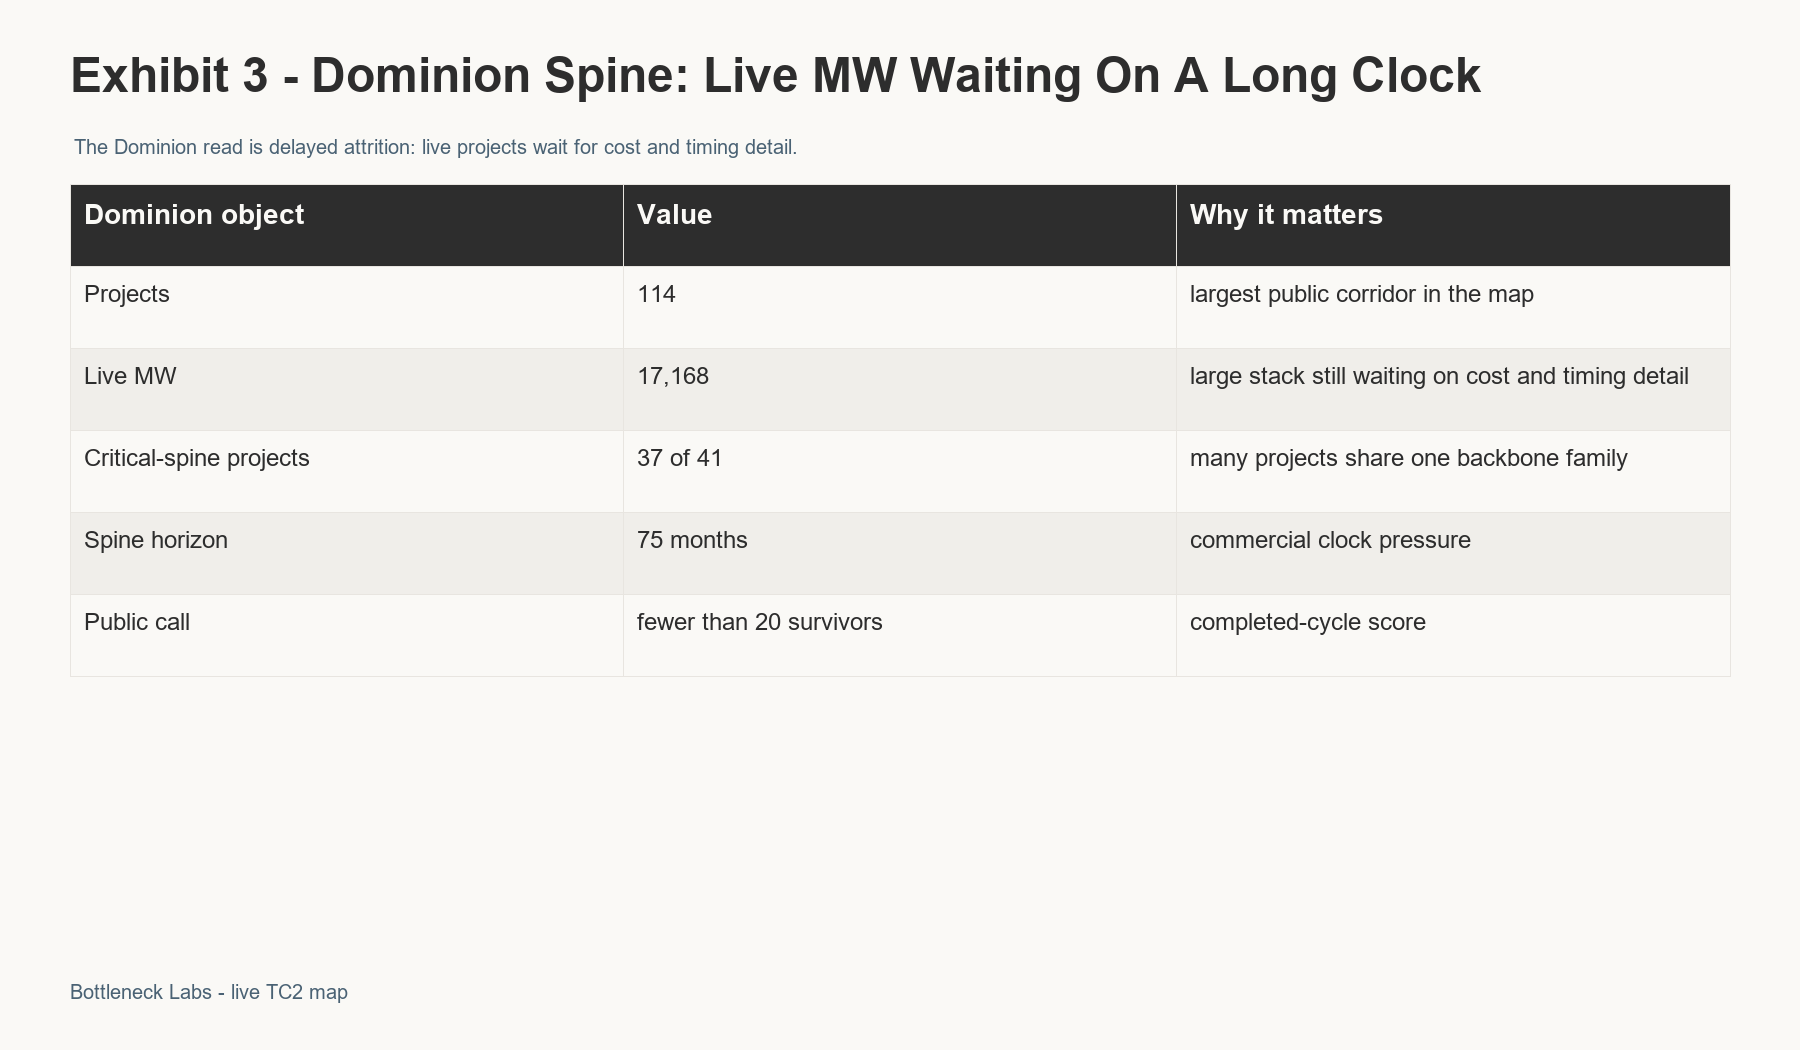
Dominion Virginia is the largest warning. DOM Virginia Corridor has 114 projects and 17,167.7 live MW. Mid-cycle exit is 32.5%. Impaired-live share is 25.4%. The clock mismatch is 39 months. At the center sits the Dominion backbone family, where 37 of 41 critical-spine projects route through the same long-clock spine. The spine horizon reaches 75 months. The power-system reliability claim is separate. For many interconnection agreements, commercial operation runs through the backbone build.
This is the corridor where Phase I is most useful as a warning. Dominion's corridor table already shows a large live-MW stack, many projects tied to backbone families, and a spine horizon longer than most commercial timelines can absorb. The next question is which projects have enough sponsor strength, queue position, interconnection flexibility, or load-side value to survive the backbone clock.
The commercial risk is delayed attrition. A project can stay nominally alive as long as waiting preserves option value. Phase II can change that calculus because it converts a corridor warning into facility-level cost and timing detail. If the spine-impaired set converts into exits, the Dominion call was early. If it stays live, the model has to give more weight to sponsor strength, queue optionality, or corridor-specific relief.
MAIT Pennsylvania is the clearest current collapse. MAIT Pennsylvania Corridor has 44 projects and 1,410.9 live MW. Mid-cycle exit is 70.5%. Impaired-live share is 65.9%. The clock mismatch is 63 months. Pierce Brook-Lewis Run 230 kV has 8 projects and 1,730 MW. Every project in that cluster is terminal in the current record. The public record already shows a node-level failure pattern.
MAIT also disciplines the territory read. The corridor aligns with territory-regime pressure. The fully exited Pierce Brook-Lewis Run cluster supplies mechanism-level evidence because it shows the node where the queue already broke.
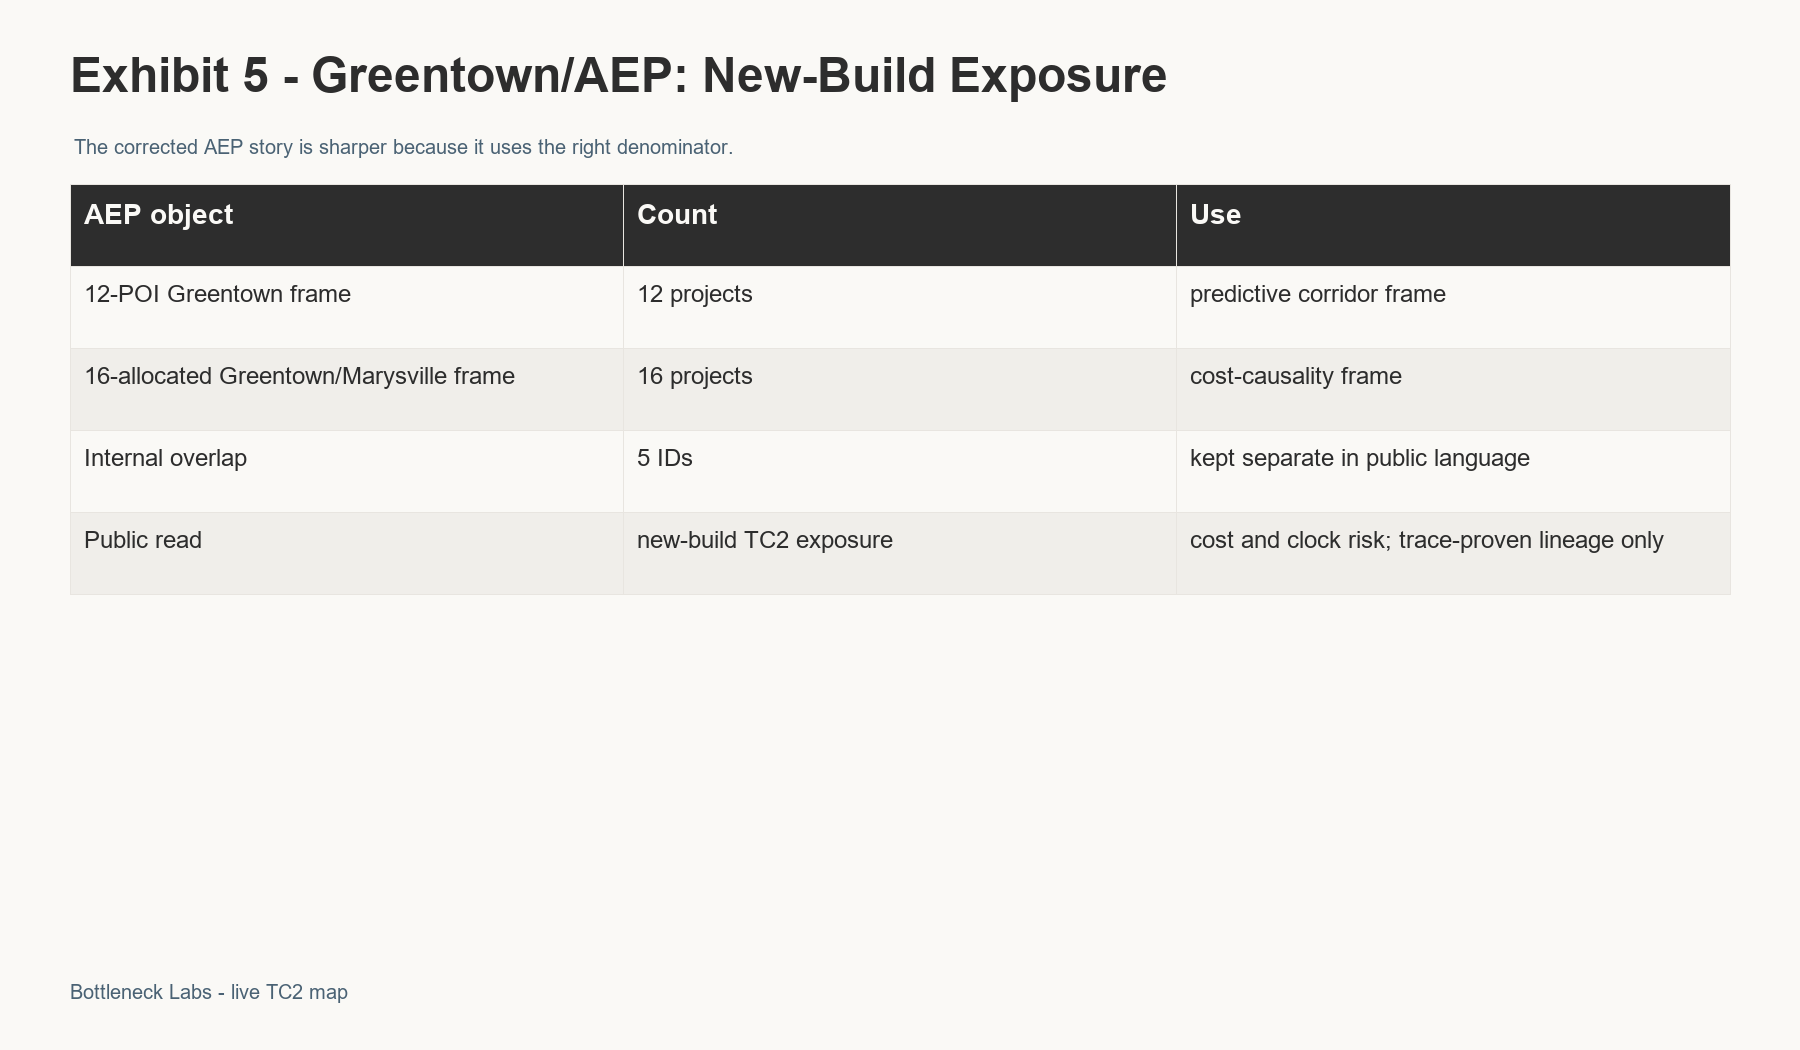
At AEP Indiana, the issue is Greentown/Marysville new-build exposure. AEP Indiana Corridor has 49 projects and 6,530.5 live MW. Mid-cycle exit is 36.7%. Impaired-live share is 18.4%. The clock mismatch is 84 months. Jefferson-Greentown and Dumont-Greentown are severe TC2 exposures. The TC1 re-kill label stays off the claim. The stronger read is that Greentown/Marysville is a large new-build burden with a long clock. The corridor map tracks the exposed POI clusters. The controlled allocation file assigns the cost burden to project rows.
The Greentown/Marysville Greenfield Line is still the headline infrastructure burden. Twelve POI-cluster projects define the corridor map. Sixteen allocated projects hold the cost-causality evidence in the controlled file. The distinction prevents a corridor call from becoming a false project-level allocation claim.
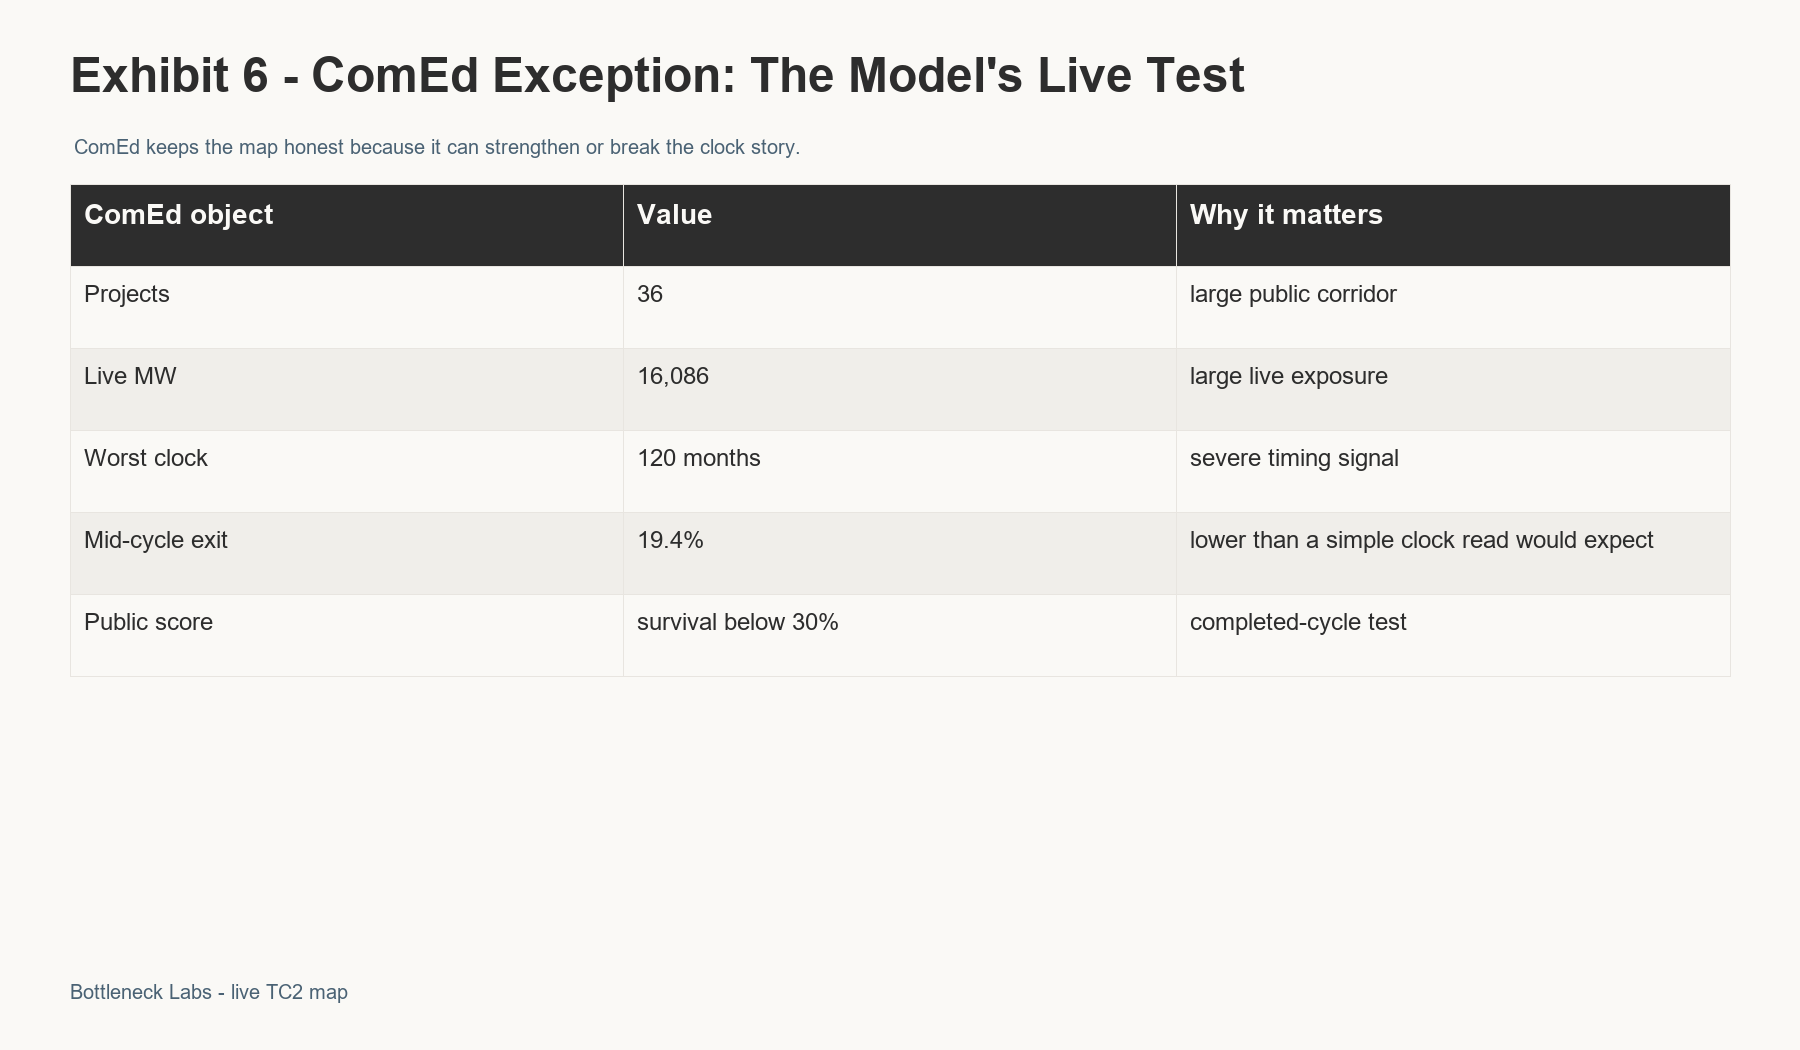
ComEd Illinois is the counterweight. CE Illinois Corridor has 36 projects and 16,085.8 live MW. Mid-cycle exit is 19.4%. Impaired-live share is 44.4%. The clock mismatch is 84 months. CE-001 has a 120-month worst-case clock and more than 16 GW of live MW. Its mid-cycle exit rate is still low compared with the other stressed corridors. If ComEd stays resilient through the completed cycle, the model needs to give the local regime more weight. If it catches down to the clock model, the current resilience was timing noise.
ComEd is a real falsifier and a live exception. Completed-cycle resilience would push more weight toward local regime, threshold elimination, sponsor quality, or project mix. Accelerated attrition after Phase II would strengthen the clock model. Either outcome changes the next diligence memo.
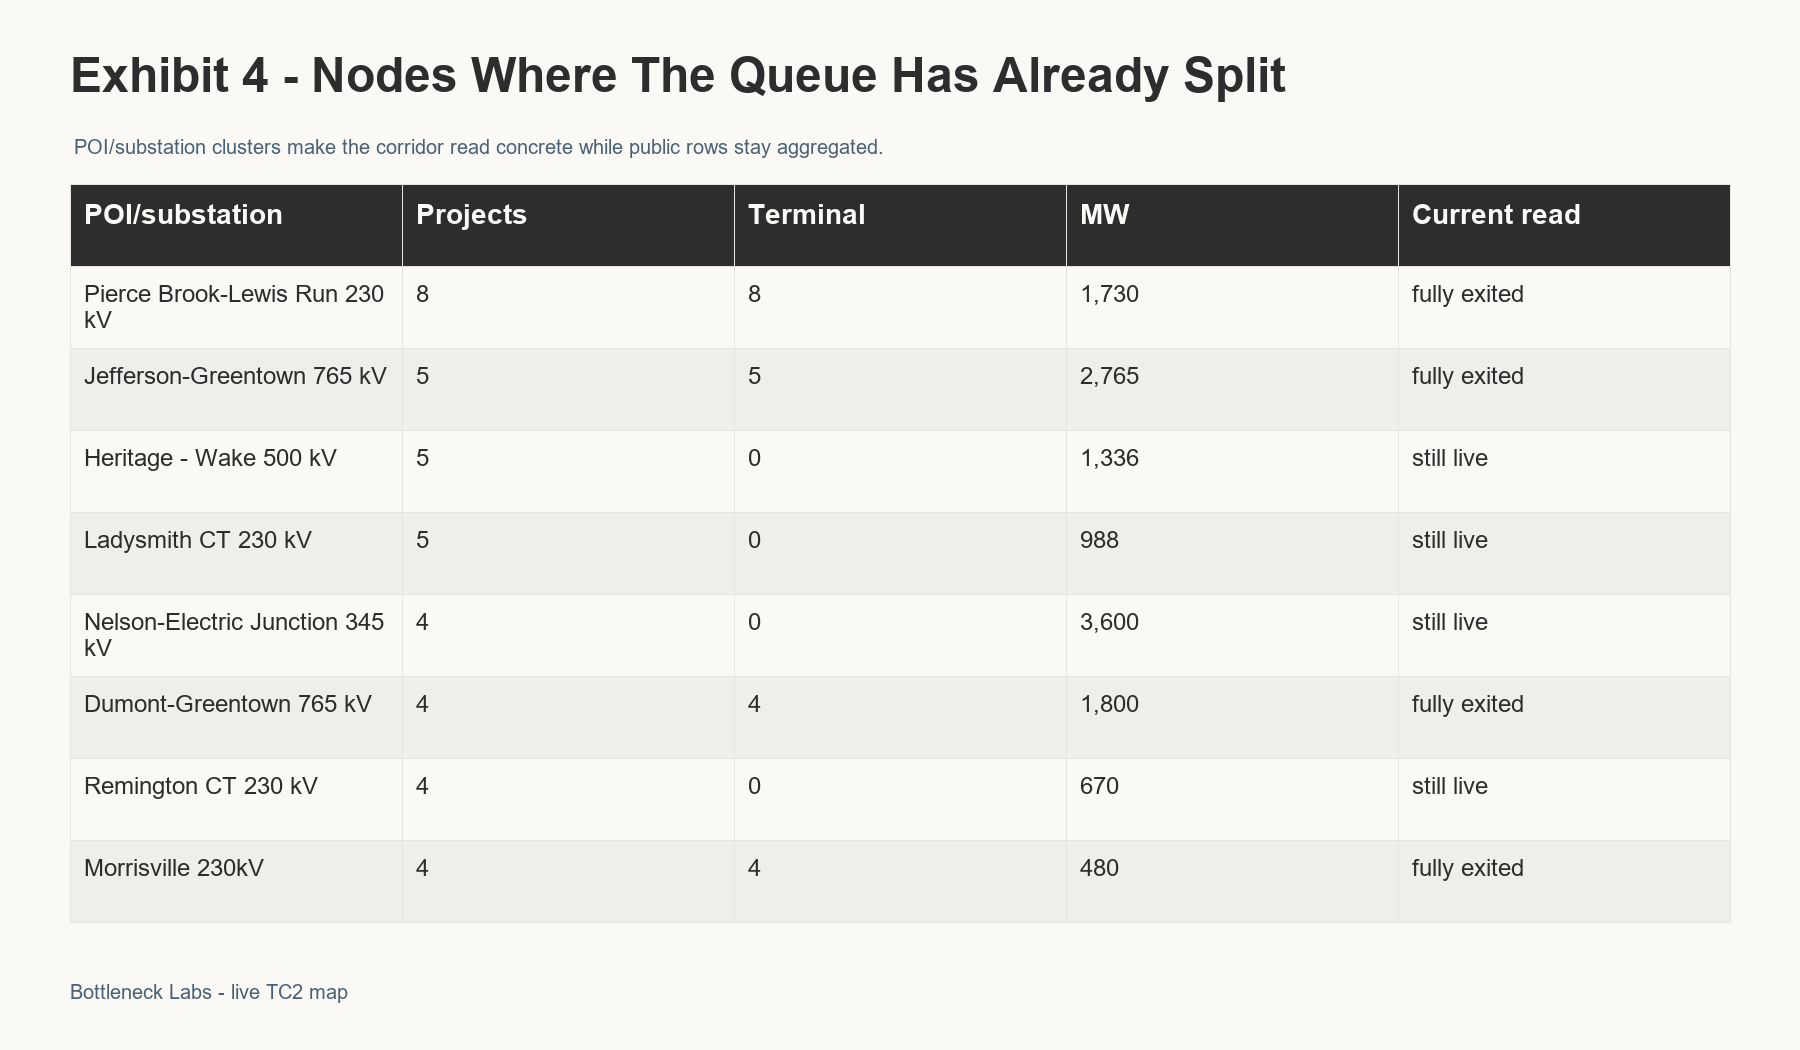
| POI/substation cluster | Corridor | Projects | Live | Terminal | Current read |
|---|---|---|---|---|---|
| Pierce Brook-Lewis Run 230 kV | CORR-MAIT-001 | 8 | 0 | 8 | fully exited cluster; 100.0% exit; 1,730 MW |
| Jefferson-Greentown 765 kV | CORR-AEP-001 | 5 | 0 | 5 | fully exited cluster; 100.0% exit; 2,765 MW |
| Heritage - Wake 500 kV | CORR-DOM-001 | 5 | 5 | 0 | still-live cluster; 0.0% exit; 1,336 MW |
| Ladysmith CT 230 kV | CORR-DOM-001 | 5 | 5 | 0 | still-live cluster; 0.0% exit; 988 MW |
| Nelson-Electric Junction 345 kV | CORR-CE-001 | 4 | 4 | 0 | still-live cluster; 0.0% exit; 3,600 MW |
| Dumont-Greentown 765 kV | CORR-AEP-001 | 4 | 0 | 4 | fully exited cluster; 100.0% exit; 1,800 MW |
| Remington CT 230 kV | CORR-DOM-001 | 4 | 4 | 0 | still-live cluster; 0.0% exit; 670 MW |
| Morrisville 230kV | CORR-DOM-001 | 4 | 0 | 4 | fully exited cluster; 100.0% exit; 480 MW |
| Cunningham 500 kV | CORR-DOM-001 | 3 | 3 | 0 | still-live cluster; 0.0% exit; 2,552 MW |
| Marysville-Flatlick 765 kV | CORR-AEP-002 | 3 | 3 | 0 | still-live cluster; 0.0% exit; 1,200 MW |
| Dequine-Eugene 345 kV | CORR-AEP-001 | 3 | 3 | 0 | still-live cluster; 0.0% exit; 950 MW |
| Rogers Road - Carson 500 kV | CORR-DOM-001 | 3 | 2 | 1 | mixed cluster; 33.3% exit; 540 MW |
The node table explains why territory labels are too blunt. Pierce Brook-Lewis Run and Jefferson-Greentown already show complete or near-complete attrition. Dumont-Greentown, Morrisville, and several Dominion nodes show the same pattern. Other nodes inside stressed corridors still have multiple live projects. That split gives diligence a starting point.
For that reason, the public evidence file stays at the POI/substation level. It shows concentration, neighbor behavior, and corridor posture. Parent-account overlays and customer-specific load work require a separate source gate. That boundary keeps the cluster row as a diligence starting point, then points to the deeper account file an operator would build next.
Greentown/Marysville is a severe TC2 new-build exposure. Start with cost and timing. Allocation and neighbor pressure come next. Recycled-lineage language belongs only where the line-item evidence proves it. That boundary keeps the sentence tied to the evidence on the page.
The distinction is practical. The 12-POI frame asks which POI clusters sit in the Greentown/Marysville corridor and belong in the prediction map. The 16-allocated frame asks which projects received the cost burden in the allocation file. A diligence memo should keep them separate unless it is tracing a specific project row in the controlled project file.
A first-time TC2 construction burden can still break projects. The binding facts are cost and clock. The lineage label controls what can be claimed in public.
ComEd gives the clock thesis a live falsifier. CE-001 has a severe clock and large live MW exposure, yet the current exit rate is lower than a simple clock model would expect. The gap turns the next TC2 records into a useful test with an accountable threshold.
Completed-cycle resilience would push more weight toward local regime, threshold elimination, sponsor quality, or project mix. Accelerated attrition after Phase II would strengthen the clock model. Either outcome changes the next diligence memo.
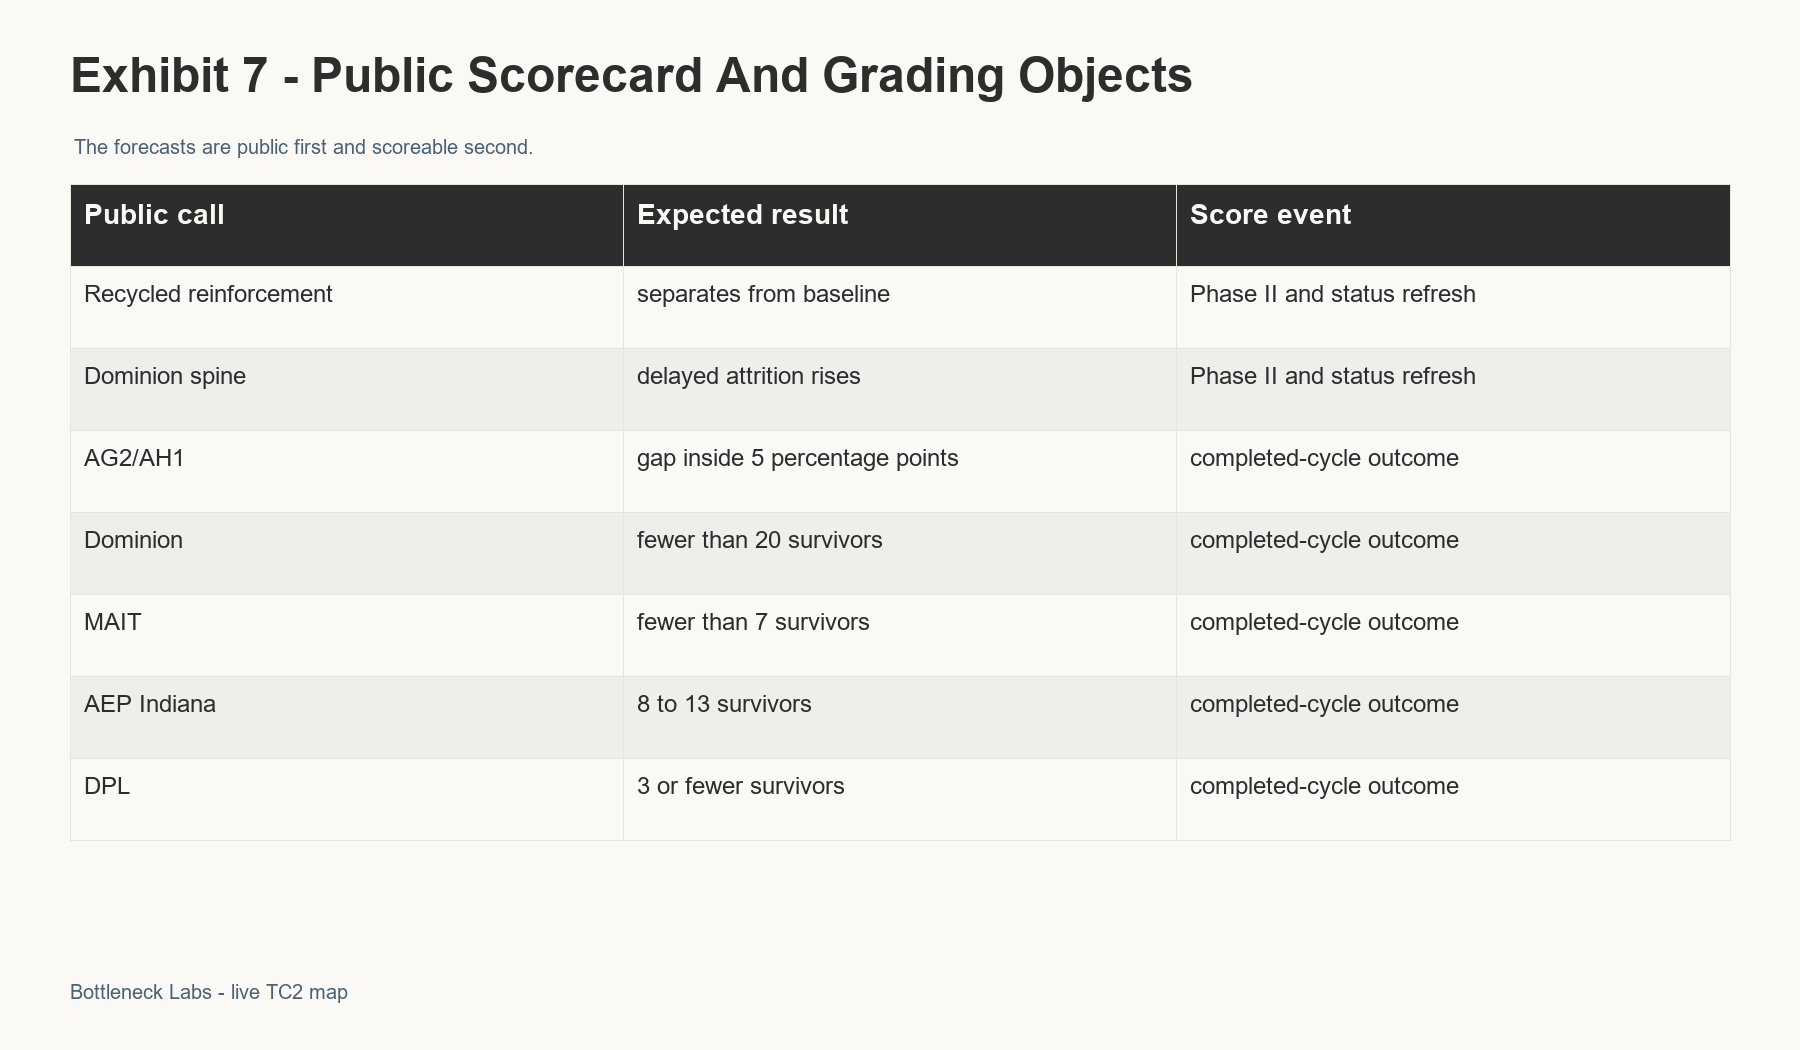
The scorecard is the longer update contract. A corridor story needs a future record that can move the map. Recycled-linked projects need to separate from baseline after Phase II has a clean status window. Dominion spine exposure needs to convert from option-value waiting into exits if the delayed-attrition read is right. ComEd gets to break the clock thesis if it survives. The corridor survivor thresholds cover Dominion plus MAIT plus AEP Indiana plus DPL.
| Call | Public call | Score event | Failure test |
|---|---|---|---|
| Call 1 | Recycled-reinforcement projects separate after the Phase II status window. Projects tied to recycled reinforcement families should show a materially higher exit rate than the baseline after Phase II detail has had time to appear in status records. | PJM TC2 Phase II results plus the first clean post-Phase-II project-status snapshot | Linked-minus-baseline terminal-exit spread is below 10 percentage points at the status-window grading snapshot |
| Call 2 | Dominion spine attrition arrives after cost detail. Critical-spine impaired-live projects should begin converting into exits during the first clean post-Phase-II status window. | PJM TC2 Phase II cost estimates plus the first clean post-Phase-II project-status snapshot | Terminal exit rate is <=40% at the status-window grading snapshot |
| Call 3 | Severe clock corridors finish below their survivor thresholds. AEP Indiana and ComEd should finish below the survival levels implied by a clean, financeable clock. | PJM TC2 completed-cycle outcome materials | AEP-001 survival >=20% or CE-001 survival >=30% |
| Call 4 | AG2 and AH1 converge at the end of TC2. The completed-cycle gap between AG2 and AH1 should finish inside five percentage points. | PJM TC2 completed-cycle outcome materials | Completed-cycle AG2/AH1 survival gap is >=5 percentage points |
| Call 5 | Dominion Virginia finishes with fewer than 20 survivors. The Dominion Virginia corridor should lose most remaining projects before the completed-cycle outcome. | PJM TC2 completed-cycle outcome materials | CORR-DOM-001 has >=20 survivors |
| Call 6 | MAIT Pennsylvania finishes with fewer than seven survivors. MAIT's mid-cycle collapse should persist through the completed-cycle count. | PJM TC2 completed-cycle outcome materials | CORR-MAIT-001 has >=7 survivors |
| Call 7 | AEP Indiana lands in a narrow survivor band. AEP Indiana should finish with 8 to 13 survivors after the Greentown/Marysville burden is priced. | PJM TC2 completed-cycle outcome materials | CORR-AEP-001 has <8 or >13 survivors |
| Call 8 | DPL finishes with three or fewer survivors. DPL's current attrition should leave a very small completed-cycle survivor set. | PJM TC2 completed-cycle outcome materials | CORR-DPL-001 has >=4 survivors |
Each failure line gives the map a source object and a miss condition. The next public record can then change the call and force a map update. Scoring discipline matters more than directional color.
| Scorecard row | Why the failure line is set there |
|---|---|
| Row 1 | The current Phase I spread is effectively zero: 38.4% terminal for confirmed recycled-linked projects versus 38.2% for the non-linked baseline. The public call requires a 10-point spread after the Phase II status window so ordinary TC2 attrition does not masquerade as recycled-reinforcement signal. |
| Row 2 | The Dominion spine call is graded on the impaired-live subset after Phase II detail has had time to hit statuses. A 40% terminal conversion line asks whether cost detail turns option-value waiting into exits. |
| Row 3 | AEP Indiana and ComEd are severe-clock corridors. The 20% and 30% survival lines are intentionally corridor-specific. ComEd is the model exception. AEP Indiana is the Greentown/Marysville burden case. |
| Row 4 | TC2 mid-cycle evidence breaks the clean TC1 vintage monotonicity transfer. A 5-point completed-cycle gap is the line between convergence and a real vintage split. |
| Row 5 | Dominion starts with 114 public corridor projects. Fewer than 20 completed-cycle survivors means the delayed-attrition thesis was material in completed-cycle terms. |
| Row 6 | MAIT already has a 70.5% mid-cycle exit rate and a fully exited 1,730 MW node. Seven or more survivors would mean the collapse read overstated persistence. |
| Row 7 | AEP Indiana has 49 projects and the Greentown/Marysville new-build burden. The 8 to 13 band requires the burden to matter without pretending the corridor goes to zero. |
| Row 8 | DPL is a small, high-attrition corridor. Four or more survivors would break the narrow collapse call. |
Each call points to a future source object that can trigger a watchlist change, account memo, or map revision. A wrong call still teaches which corridor logic failed. If ComEd survives, the severe-clock-alone model loses weight. If Dominion survives through the status window, delayed attrition was overstated. If recycled-linked projects fail to separate from baseline, the TC1-to-TC2 recurrence bridge gets narrower.
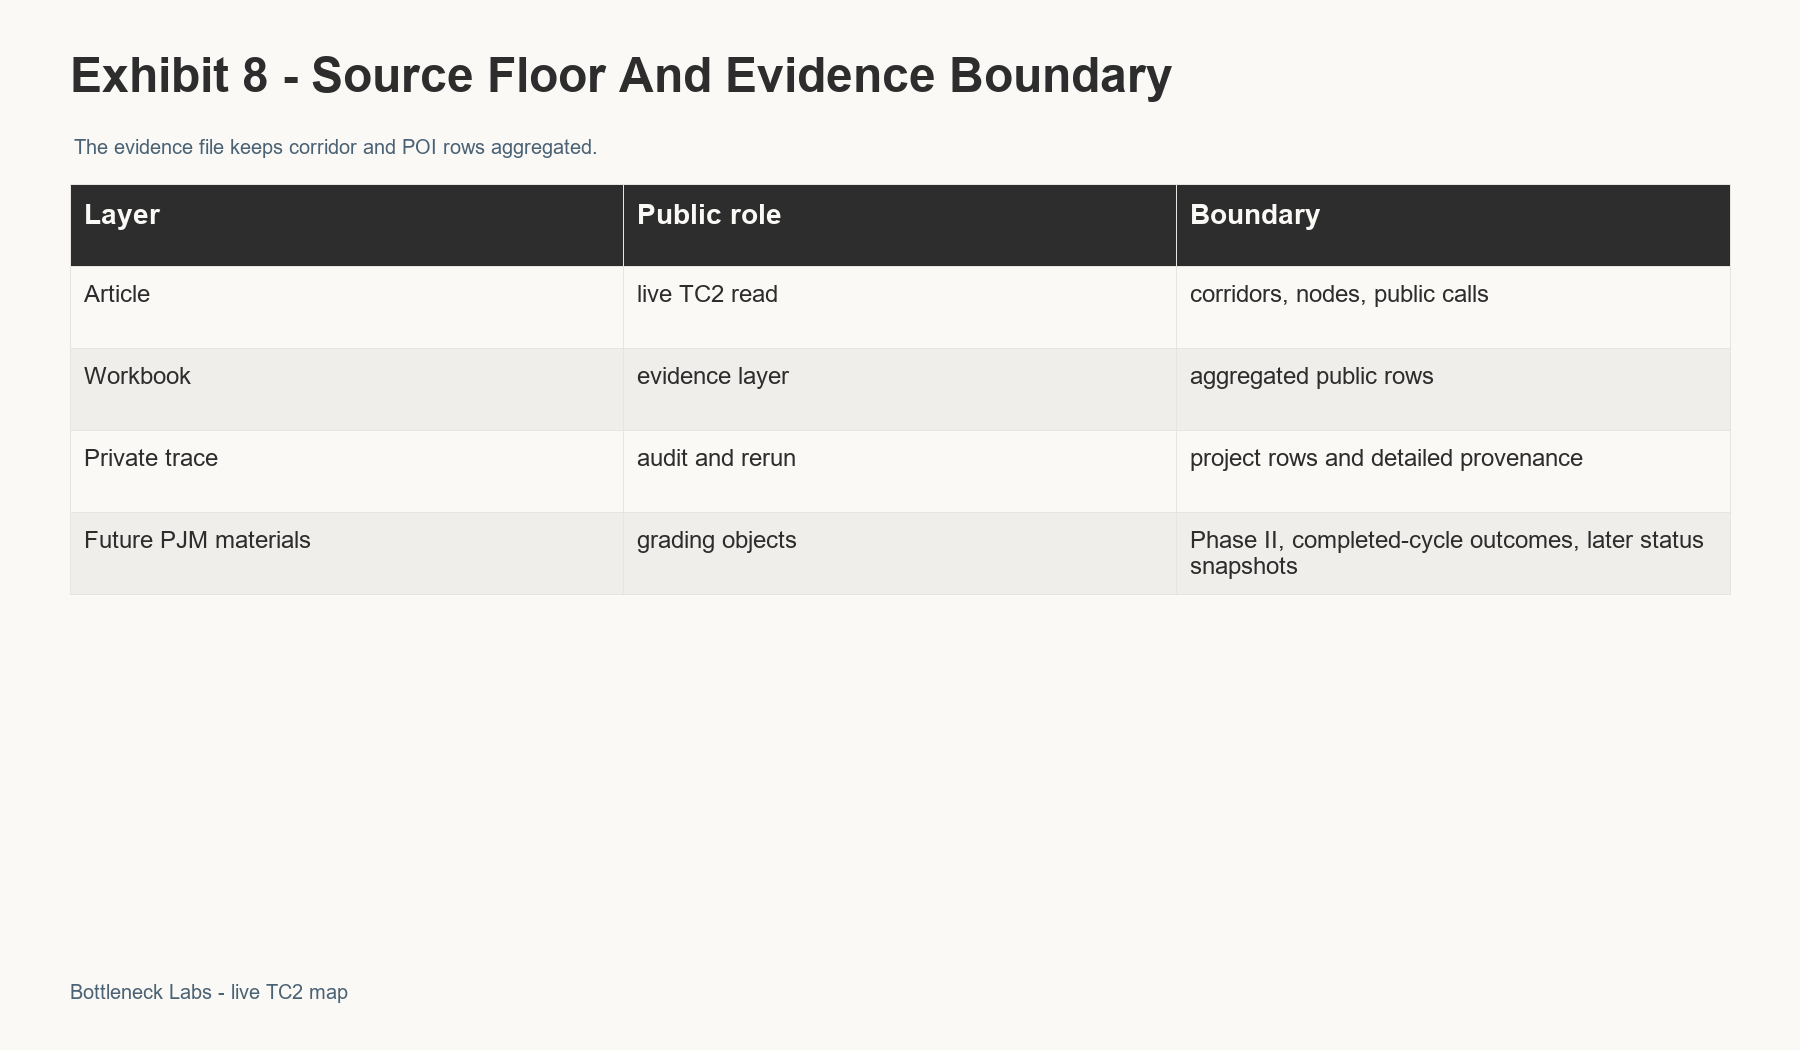
The argument rests on a small source floor. PJM TC2 Phase I materials supply the live study record. PJM cycle service-request status data supplies the status overlay. TC1 Final SIS materials supply the completed-cycle reference. Derived corridor scores and derived POI/substation clusters sit on top of those sources. The prediction control record sits there too. The sources support the argument first. The evidence file adds derived layers and the scorecard after the corridor argument has done its work.
| Source object | Source anchor | What it supports |
|---|---|---|
| PJM TC2 Phase II schedule update | https://www.pjm.com/-/media/DotCom/committees-groups/subcommittees/ips/2026/20260126/20260126-item-03---cycle-schedule-update.pdf | 2026-06-01 Phase II report date, 270 studied projects, and 8 accelerated-to-final-agreement projects |
| PJM TC2 Phase I executive summary and workbooks | PJM TC2 Phase I study materials | 450-project universe, reinforcements, POI/substation strings, corridor fields |
| PJM cycle service-request status records | PJM cycle service-request status page and dated capture | live and terminal project status overlay |
| PJM TC1 Final SIS materials | PJM TC1 Final SIS workbook and R2 reinforcement matching method | recycled-reinforcement reference frame |
| Derived corridor scores | Bottleneck Labs derived corridor score layer | 27 corridor profiles and public ranking fields |
| Derived POI/substation clusters | Bottleneck Labs derived POI/substation cluster layer | 354 public POI/substation clusters |
| Prediction control record | Bottleneck Labs prediction ledger and status register | scoreable public calls and grading status |
The evidence file contains overview and corridor reads, POI/substation clusters, and specific cases. The prediction scorecard sits in the same file. So do the definitions, source method, and update log. Its rows stay aggregated at corridor and POI/substation level. Project-row detail remains a separate controlled surface. That split lets the map be inspected as a TC2 risk surface before any sponsor-level dossier work begins.
The next grading set starts with TC2 Phase II cost publication. Completed-cycle outcome materials come after that, followed by later PJM status captures and relevant Cycle 1 study scopes. The sequence tests the live cost map first. Later artifacts test survival and attrition timing, then update behavior and recurring corridor pressure. A clean result changes corridor confidence, account routing, or the next watchlist.