Exhibit 1: TC1 Attrition Funnel
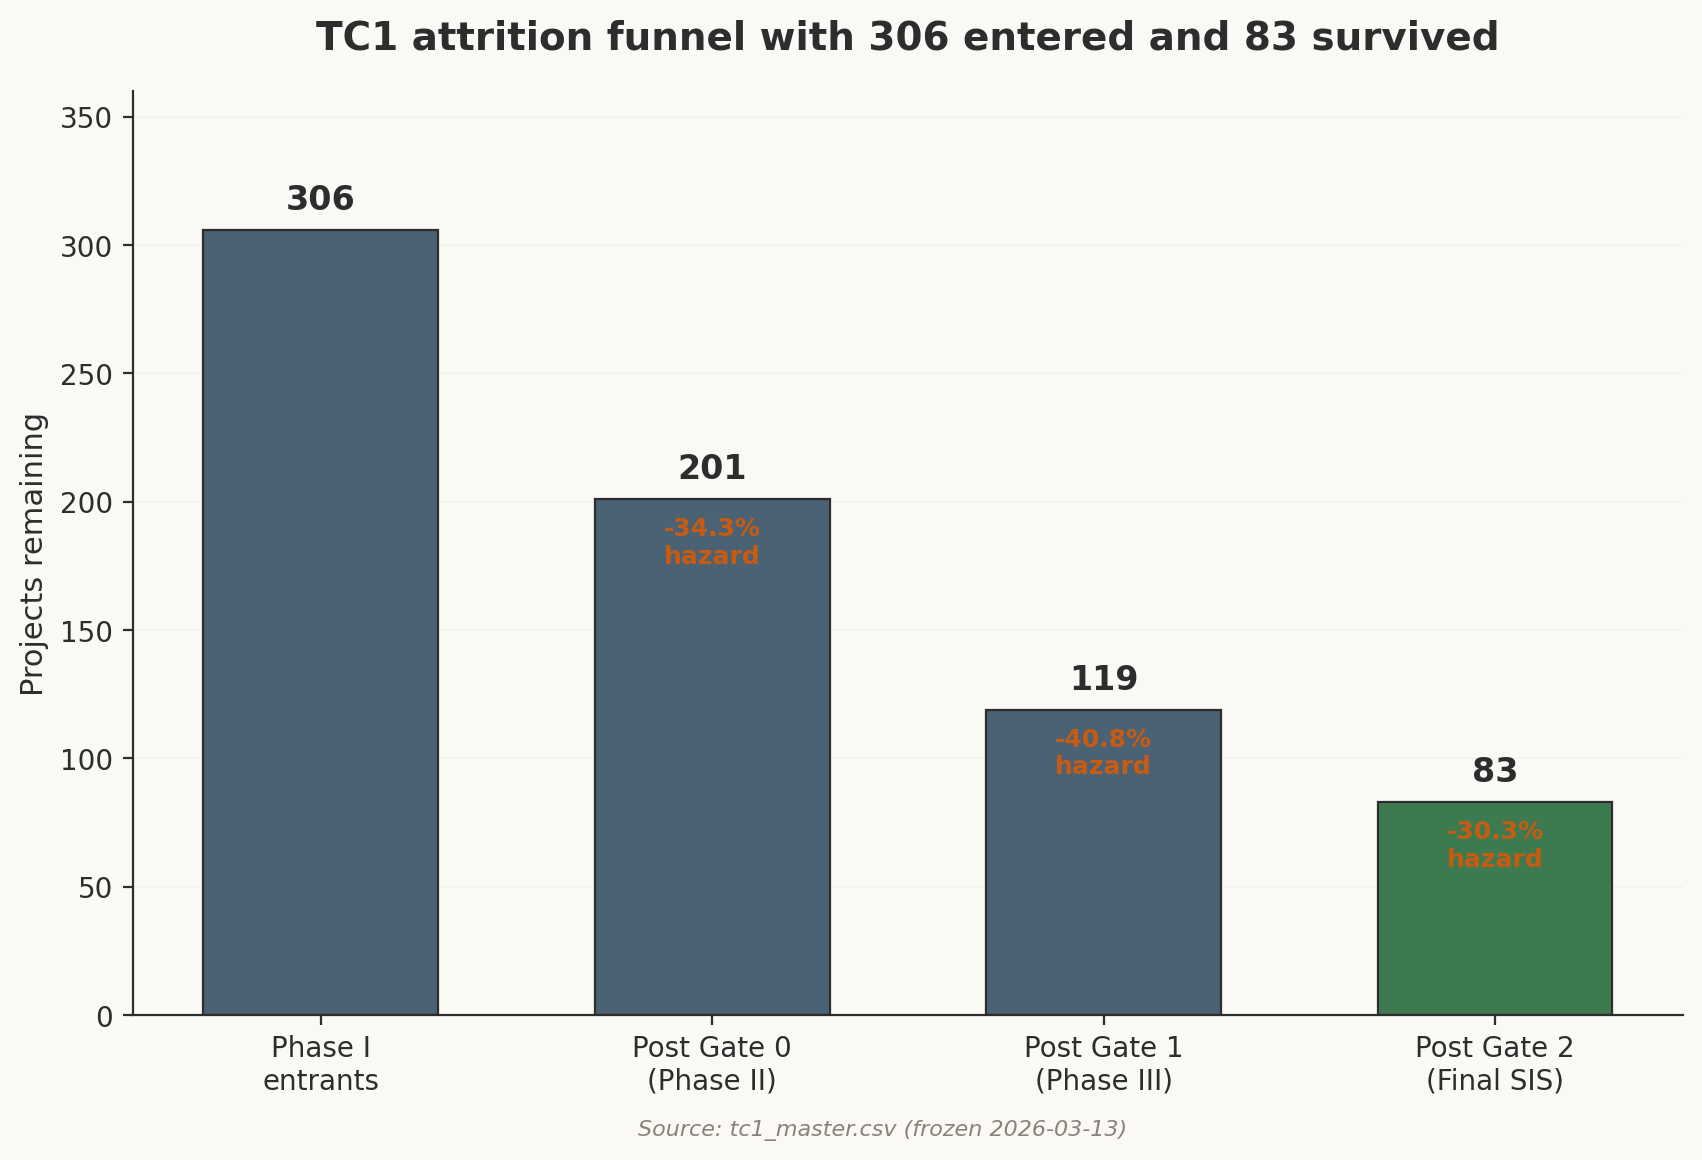
Transition Cycle 1 is the first completed public record of PJM's new cluster-study process. A large backlog of proposed projects entered the same study universe and met the same grid model. Each project then faced cost and timing decisions. Security and agreement decisions followed.
Bottleneck reconstructed TC1 so an infrastructure fund or power investor can see which positions survived and which exposures were visible before withdrawal. The governing claim is direct. The first cost letter is the opening number. The underwriting object starts with the point of interconnection, or POI. It adds substation position and System Reliability Network Upgrade share, abbreviated SR NU below. Neighbor status and the next PJM document then decide whether the exposure can be repriced. Developers and platform owners can use it. Lenders and power buyers use the same record when their exposure connects to an interconnection point, reinforcement family, or delivery clock.
| Diligence job | First object to open | What changes |
|---|---|---|
| Fund diligence | Phase I cost letter plus SR NU share | The headline cost becomes a channel mix and neighbor-dependency question. |
| Project development | POI/substation cluster | Territory average gives the prior; the node gives the exposure. |
| Lender or offtaker review | Next PJM grading object | Security, COD, and milestone risk move with Phase II, Phase III, Final SIS, and later status records. |
| TC2 watchlist | Recycled reinforcement family and corridor card | Completed-cycle TC1 mechanics become scoreable live-cycle tests. |
On July 10, 2023, PJM moved new interconnection requests from a serial study process into a cluster process. Transition Cycle 1 is the first transition cycle with a completed public endpoint. Most queue commentary stops before final study records arrive. TC1 gives a completed record of which exposures were visible before withdrawal.
Each TC1 request entered with a site and a point of interconnection. It also came with deposits and equipment assumptions. Land-control work, a buyer or revenue model, and a cohort of other proposed injections came with it. PJM and the transmission owners then studied the group against the existing grid. A commercial memo can start with land and equipment. It can add revenue and sponsor credibility. The study asks whether the generator can inject at that point, alongside the rest of the cohort, without creating a reliability violation on the network.
A network upgrade is grid work required so the project or study group can interconnect without violating reliability rules. Some upgrades are local to one project. Others are shared across projects whose injections contribute to the same overloaded line, transformer, substation, voltage condition, or contingency problem. PJM labels the shared category System Reliability Network Upgrades. The shorthand is SR NU. A point of interconnection, or POI, is the substation or interconnection point where the project proposes to enter the grid. Final SIS is the final System Impact Study state in PJM's interconnection process. Built-project proof requires later commercial and construction records.
Consider a 100 MW request under current cycle rules. Before the first withdrawal gate, it can already post a $300,000 study deposit. Readiness Deposit No. 1 can add a $400,000 obligation. The Phase I report then says whether the chosen POI pulls mostly local equipment work or a shared SR NU allocation. At that point, a spreadsheet project becomes a grid-position decision.
Interconnection consultants already know to ask about SR NU. TC1 turns that question into a completed-cohort measurement. The channel can be separated from local work, tied to POI clusters, and watched for recurrence in TC2. The consultant question is "what is the SR NU share?" The Bottleneck question is "which shared network exposure survives the cohort, which one clears when neighbors leave, and which future source object will prove the difference?"
PJM's Transition Cycle 1 ran from July 2023 through early 2026, processing roughly 46,000 MW of proposed generation across 13 transmission owner territories. Solar dominated at 160 projects. Storage was the second-largest category at 74. Wind skewed older, most having entered before the cluster transition. Seven queue vintage prefixes were represented, each encoding the filing window in which the developer originally entered the queue.
TC1 was large enough to expose allocation patterns in public. Three territories contained 76.8% of the projects. Dominion had 122, ComEd had 67, and AEP had 46. The remaining ten transmission owner territories split 71 projects among them, several with single-digit counts. The large territories contain enough projects to show allocation patterns. The smaller territories are useful mainly as directional checks.
PJM published executive summaries and individual project reports at each study phase. Those public materials make the cycle auditable. Bottleneck set out to connect project-level survival, cost-channel movement, and reinforcement recurrence inside one completed TC1 record.
In the public record Bottleneck could follow project by project, 306 Phase I projects entered the analytic cohort. Of those projects, 83 reached Final SIS and 223 exited before the final study endpoint. The first cost letter was the opening exposure. The projects then sorted by network position and SR NU share. Neighbor survival and the next study gate added go/no-go pressure that the public record can observe, even when the developer's private motive stays outside the source floor.
The TC2 link comes later in the report because it is physical. The same reinforcement family can leave one cohort's allocation and return when the next cohort stresses the same corridor. The completed TC1 funnel has to be visible first.
306 entered the reconciled Phase I cohort. 83 reached Final SIS. Each gate removes roughly a third of its entering population.
Of the 306 Phase I projects in the reconciled cohort, 83 reached Final SIS. Survival was 27.1%. PJM's broader public process counts include 311 entered requests and 87 Retool 1 remaining requests. The analytic denominator uses the 306 projects with a Phase I record that can be followed through the later study phases. Four Final SIS projects sit outside that strict Phase I-intersection universe, so they are tracked in the appendix and kept out of the survival rate.
TC1 created visible capital exposure before the first gate. Manual 14H's current cycle rules set study deposits from $75,000 to $400,000 and Readiness Deposit No. 1 at $4,000 per MW. A 100 MW request starts with a $300,000 study deposit. RD1 can add a $400,000 obligation. Site control and interconnection engineering can add more exposure before the gate. Land and sponsor work can add more. The TC1 public record leaves each developer's actual pre-gate cash spend and motive outside the source floor. The tariff schedule still puts a Gate 0 withdrawal inside a capital-exposure file. Project-specific motive remains private.
The loss starts early. Gate 0, the Phase I to Phase II transition and Decision Point 1 in PJM nomenclature, drops 105 projects for a 34.3% hazard rate. These exits happen before developers see retooled, facility-level cost estimates from transmission owners. The preliminary Phase I answer, or the experience of being inside the cluster study at all, is enough to push a third of the cohort out before the real numbers land.
Gate 0 exits are early decisions under incomplete engineering detail. Developers have seen the planning-level network answer, the first allocation scale, and the first version of the neighbor problem. Some projects entered with economics thin enough to pass the queue-entry screen and fail once the first network answer arrived. Later reform logic raises deposits, site-control rules, and commercial-readiness milestones to move weak projects out earlier. TC1 shows how much exposure still appears inside the study after that screen.
Gate 1, Phase II to Phase III, drops 82 more projects. The 40.8% hazard rate is the highest single-gate hazard in the funnel. By then, transmission owners have completed facility-level engineering with actual equipment specifications. Current steel and copper prices enter the estimate. Specific right-of-way requirements and contractor availability enter the construction timeline. The cost estimate is now close enough to the binding figure for a developer's lender, offtake counterparty, or investment committee to make a go/no-go decision.
The economic model can break before the engineering detail is final. By Gate 1, the study has moved from broad screening into facility-level commitment. The project is now close enough to final cost and schedule exposure for a lender, offtaker, or investment committee to stop funding the path.
Gate 2, Phase III to Final SIS, drops 36 projects before the Final SIS and final-agreement negotiation endpoint. The hazard rate is 30.3%. Developers who reach this point have already absorbed one cost shock and demonstrated willingness to continue. The last filter is decisional. Stay in the process as security and agreement obligations harden, or exit before those obligations become more difficult to unwind.
Two dynamics explain Gate 2 attrition. Late-stage withdrawals by co-dependents can reshuffle cost allocations for projects that remain, changing security and agreement exposure after earlier study rounds. Some projects also face infrastructure schedules that are difficult to reconcile with offtake milestones, debt drawdown windows, or sponsor return requirements. The endpoint here is study survival. Agreement execution and construction move on a later clock.
Read the funnel gate by gate. From Phase I to Phase II, 105 projects leave. From Phase II to Phase III, 82 more leave. Before Final SIS, another 36 leave. The hazards are 34.3%, 40.8%, and 30.3%. Gate 1 is the sharpest filter because the process has moved from planning estimate to facility engineering and agreement exposure.
The dataset was reconstructed project by project across all four study phases from PJM-posted results. Bottleneck uses 306 Phase I projects because those requests can be followed through the completed-cycle study record. It uses 83 Final SIS projects because those survivors sit inside the same Phase I intersection. PJM's broader public process counts of 311 entered requests and 87 Retool 1 remaining requests remain visible in the appendix. Those counts include records outside the strict Phase I-to-Final SIS record used for survival analysis. Every number here traces to a CSV row, workbook cell, or documented calculation step.
| Question | Claim | Exhibit | Support route |
|---|---|---|---|
| How many projects reached Final SIS? | 83 of 306 Phase I projects in the reconciled cohort reached Final SIS. | Exhibit 1 | Workbook TC1 Universe, data appendix Denominator Crosswalk |
| Which cost channel moved? | System Reliability Network Upgrades account for the survivor cost movement. | Exhibit 4 | Workbook Cost Trajectories, data appendix Cost Channel Decomposition |
| Did the first cost letter predict survival? | Phase I cost was an unstable opening number for underwriting. | Exhibit 7 | Workbook Model Diagnostics, methodology model card |
| Which reinforcements recur in TC2? | 56 of 89 Final SIS reinforcement line items reappear in TC2 Phase I under strict consensus matching. | Exhibit 9 | Workbook Reinforcement Matching, data appendix Recycling Bridge |
| What transfers into TC2? | Specific reinforcement, SR NU, and backbone-zone tests have current evidence. Vintage and whole-cycle transfer claims stay narrower. | Exhibits 11 and 13 | Prediction scoreboard, Section IX, live TC2 test notes |
Territory timing is the first correction to a simple survival table. A fund looking at a PJM portfolio needs to know when a territory usually forces the decision. Early attrition changes site-screening and acquisition discipline. Late attrition changes security, offtake, and financing exposure after more capital has gone in.
ComEd sits at 40.3% survival. Dominion sits at 20.5%. AEP sits at 37.0%. Several small transmission owners saw complete elimination. PPL went 0 of 5, Delmarva went 0 of 7, and Delaware projects went 0 of 5. The survival table shows where to look. The gate timing shows what kind of capital decision the territory tends to force.
ComEd, AEP, and Dominion all lose projects. Timing separates the mechanisms. ComEd forces more decisions early, AEP pushes more of the decision later, and Dominion keeps pressure on the project at every gate.
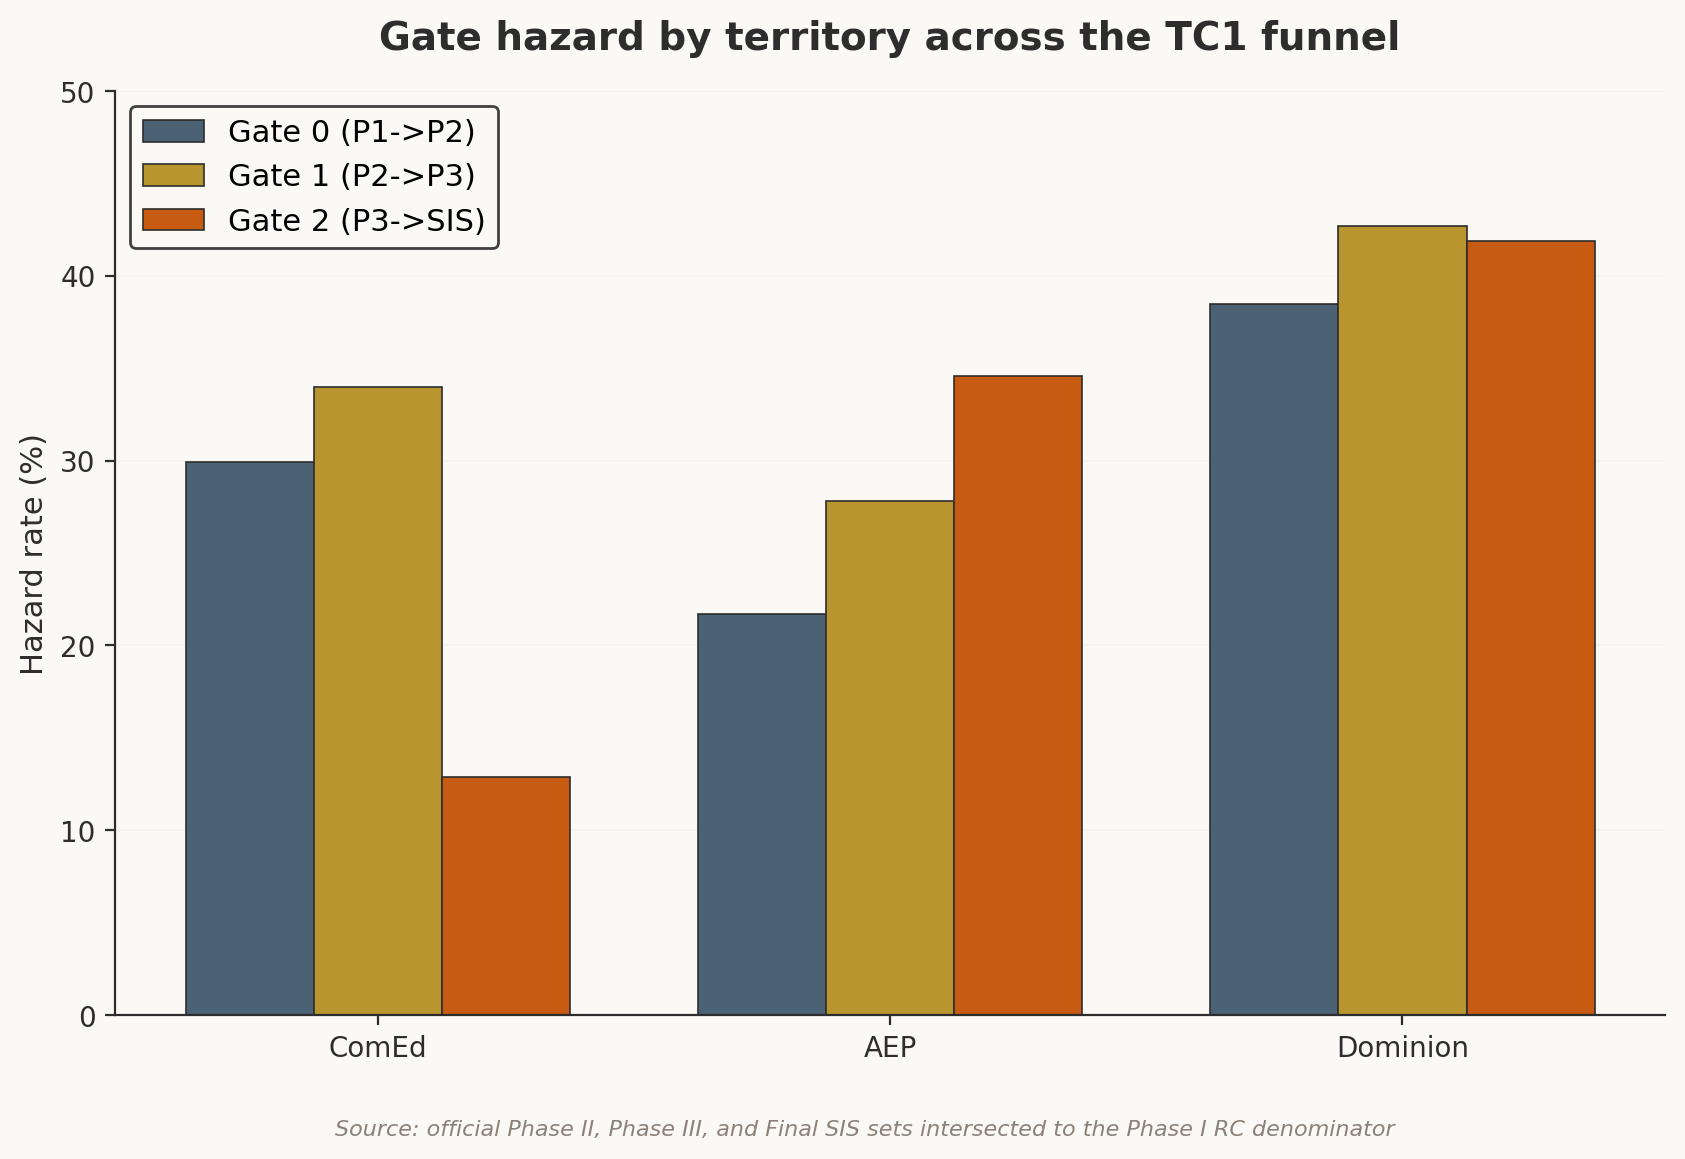
The gate hazard table separates early filtering, late burden concentration, and sustained corridor pressure.
ComEd kills early. Gate 0 (Phase I to Phase II) runs a 29.9% hazard. Gate 1 (Phase II to Phase III) runs 34.0%. By Gate 2, the hazard drops to 12.9%. A ComEd project that reaches Phase III has already passed through the worst of it.
ComEd's early kill pattern comes from threshold elimination on a dense transmission grid. The network was built for industrial Chicago. Substations are close together, and redundant transmission paths connect them at multiple voltage levels. When a generator proposes to interconnect in ComEd territory, the reinforcements it triggers tend to be local work such as a transformer upgrade at the nearest substation, a breaker replacement on an adjacent bus, or reconductoring on a segment already running near capacity.
These upgrades are cheap per unit and highly sensitive to cluster composition. One neighbor withdrawing can push loading below the thermal trigger and wipe three reinforcements off the cost allocation simultaneously. The threshold process fires fast in a dense grid because the margin between required and cleared is thin for most local reinforcements.
A 200 MW solar project connecting at the end of a Dominion corridor faces $58 million in median reinforcement costs. The same project in ComEd faces $3 million. Neither number reflects project quality, developer experience, or technology choice. Both reflect grid physics.
AEP inverts ComEd's pattern. Gate 0 hazard is a modest 21.7%. Gate 1 runs 27.8%. Gate 2 climbs to 34.6%. AEP kills late.
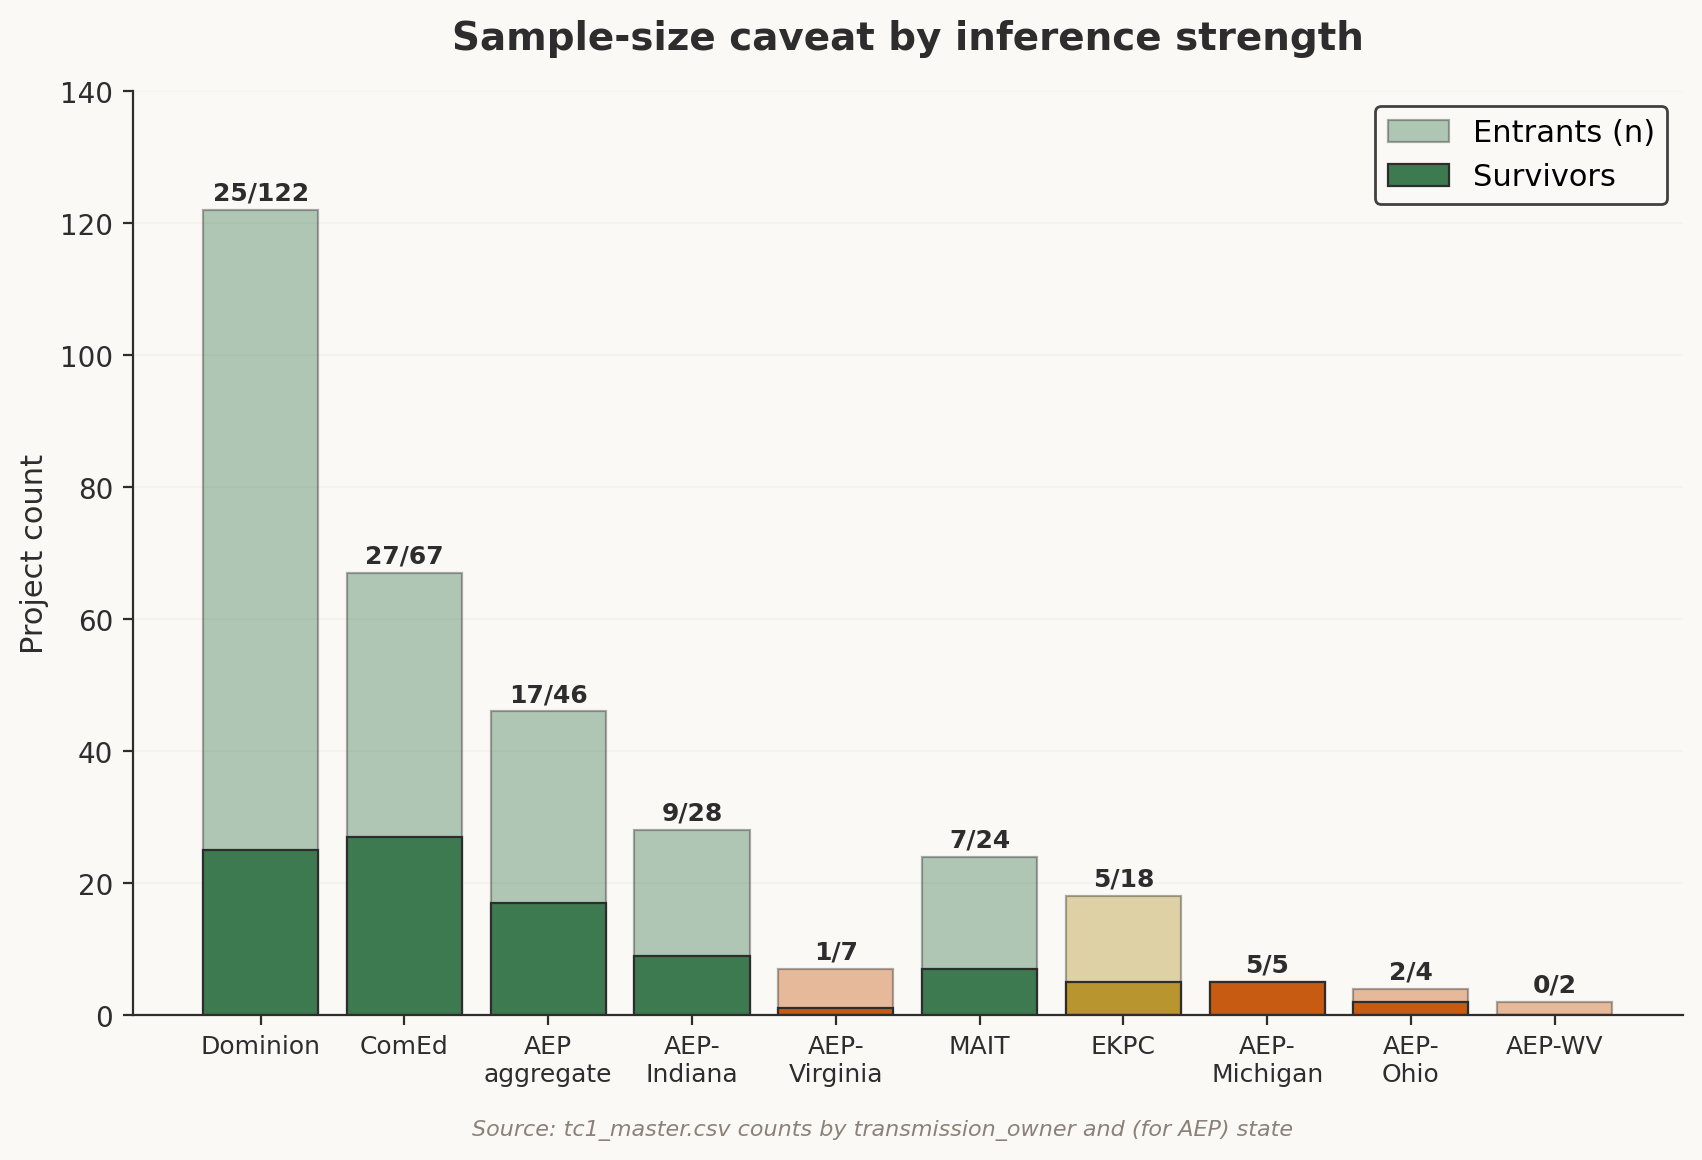
AEP is one transmission-owner label across several operating-company footprints. Twenty-eight of the 46 AEP projects are in Indiana. Seven are in Virginia and four are in Ohio. Five are in Michigan and two are in West Virginia. The late-kill signal belongs mostly to AEP-Indiana, with three small-sample exceptions.
AEP-Indiana survives at 32.1%. The territory's late-killing pattern belongs there. The Sullivan-Rockport 765 kV backbone is a high-voltage spine whose reinforcement cost is structurally sticky. As projects withdraw from AEP-Indiana, the fixed cost of the 765 kV line concentrates on the shrinking denominator of remaining projects and per-MW allocations rise. The late killing reflects cost reallocation after the withdrawal cascade has had time to run through the corridor.
AE2-130 at Rockport 765 kV entered with $54.1M in Phase I costs and was killed between Phase I and Phase III. AF1-088 at Sullivan 345 kV entered with $90.1M and was killed between Phase III and SIS. AF2-008 at Sullivan 345 kV entered with $51.7M and was killed between Phase III and SIS. All three dropped before Final SIS with backbone-grade allocations still in view.
The public record supports allocation burden and exit timing. Sponsor-level financing motives sit outside the evidence. AEP-Virginia has 7 projects and 14.3% survival. It is directionally consistent with the same pattern, though the small sample limits inferential weight. AEP-Ohio and AEP-Michigan are too small to support territory-level conclusions. Their survival rates are reported descriptively.
Dominion has no safe gate. Hazard rates run 38.5%, 42.7%, and 41.9% across the three transitions. The killing is sustained because Dominion's transmission topology creates a different physical environment than either ComEd or AEP-Indiana.
Virginia's geography produces long transmission corridors through the Piedmont-to-Tidewater run and the northern Virginia load center fed from western generation sources, with the North Carolina border region served by thermally constrained corridors adding a third axis. A generator connecting at the end of a Dominion corridor sits at the far end of infrastructure designed to deliver power outward. New generation has to push back through that same constrained path.
Accommodating that generator requires reinforcements that run back toward the backbone. The work can include multi-mile segment rebuilds and substation expansions. Contingency analysis can also expose missing backup paths. The reinforcement scope is large because the fundamental infrastructure gap is large. Threshold elimination fires at lower rates because the constraints reflect corridor depth more than temporary cluster loading.
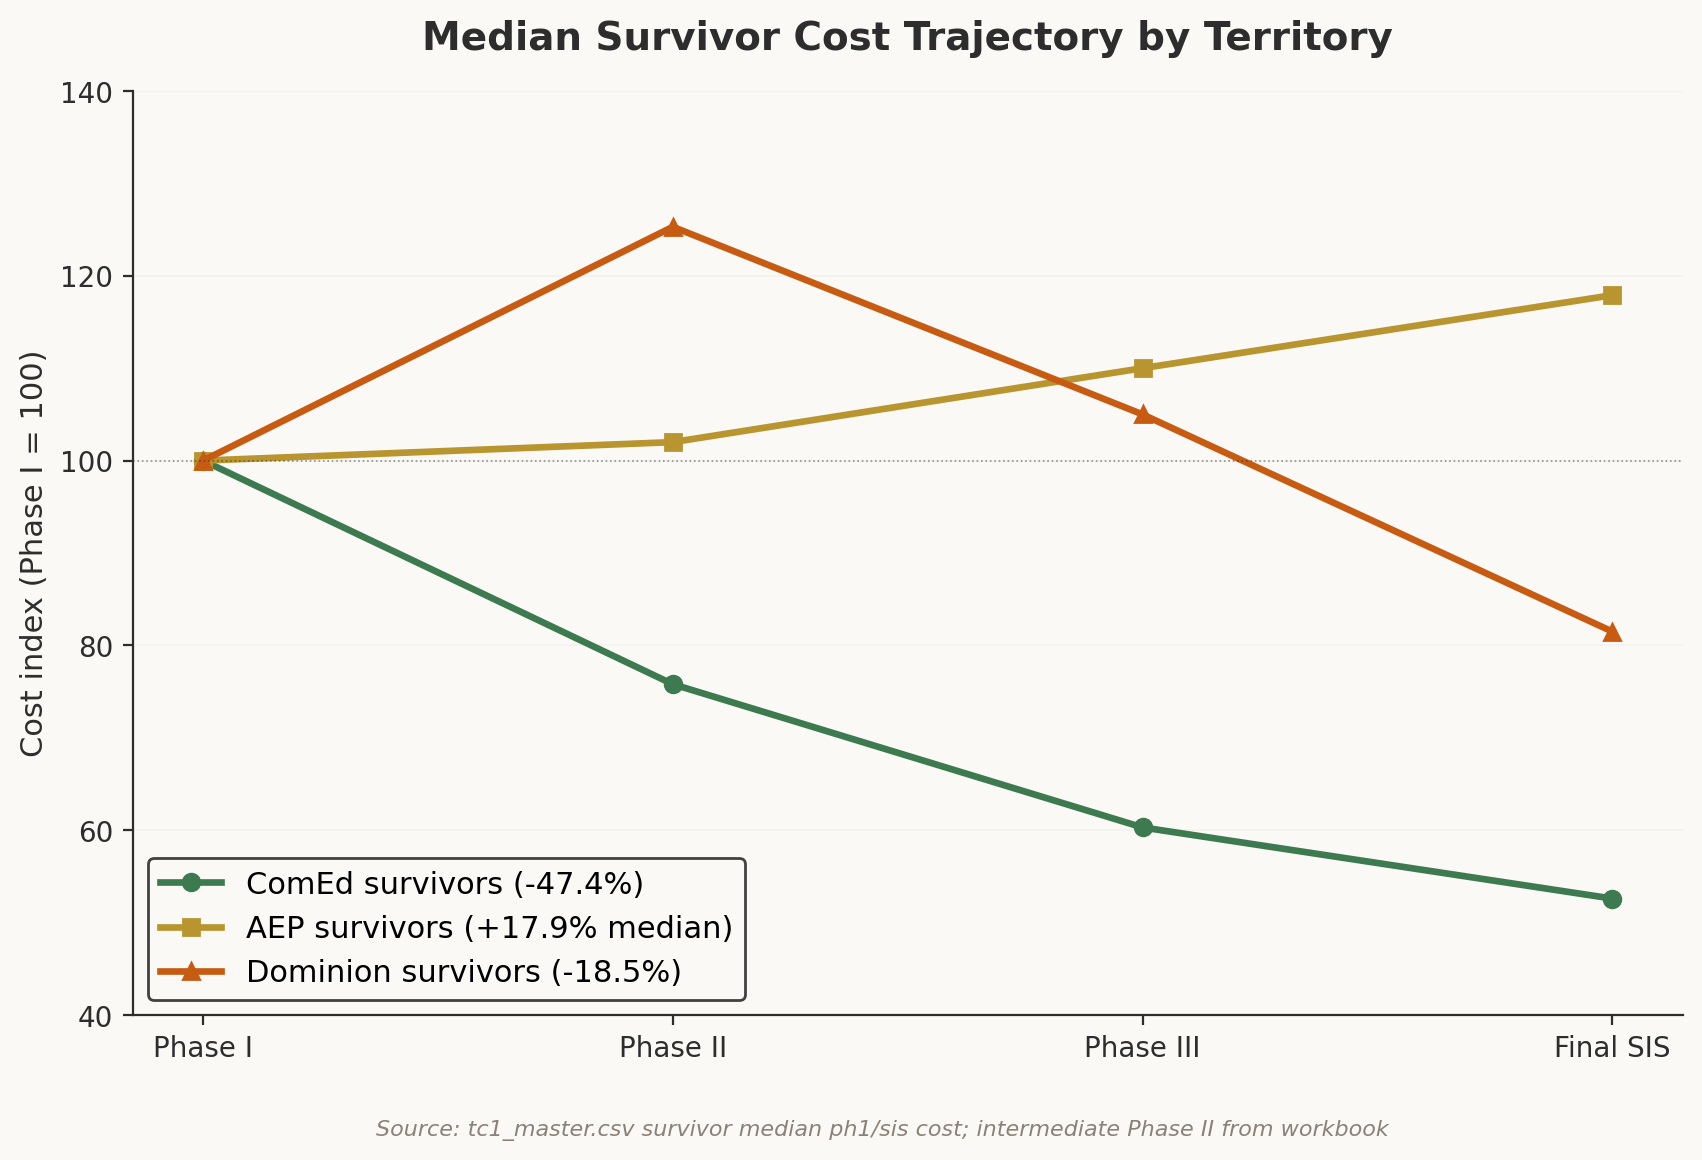
The territory signature is visible in survivor dollars and SR NU persistence.
The cost trajectories put dollars under the territory signatures. Monotonic cost decline means every study step moves in the same direction. ComEd survivors follow that pattern. Their costs fall 24.2% at Phase II and 47.4% by Final SIS as threshold eliminations remove some shared reinforcements from the allocation.
Dominion does something different. Survivor costs rise 25.3% at Phase II as facility-level engineering replaces planning-level estimates. They fall 23.5% by Final SIS as some reinforcements are rescoped. The net result is 18.5% compression, less than half of ComEd's.
AEP survivors saw per-project costs rise 17.9% from Phase I to Final SIS. The median AEP survivor left the process paying more than when it entered. The split separates aggregate territory movement from survivor-level burden.
AEP is where the table can fool an allocator. Aggregate territory-level cost fell 84.6%, from $1.114B at Phase I to $171.9M at Final SIS. Median per-project cost rose 17.9%. A few large AEP projects with massive cost drops pull the aggregate number down. The typical survivor exits the process with a higher bill. That is the live-queue version of Simpson's paradox. The aggregate and the survivor distribution answer different questions.
The zero-survival territories complete the picture. PPL's 0-of-5 and Delmarva's 0-of-7 are too small to support broad inference on their own, and they are consistent with the fixed-cost denominator pattern seen elsewhere in TC1. When a territory's grid requires backbone-grade reinforcement and only five projects share the bill, the per-project burden can become difficult to finance before project-specific quality even enters the question. Delaware, Maryland, and West Virginia produced zero survivors from a combined entry pool of ten projects. The physical problem is familiar. The denominator is smaller.
Open the cost letter and separate the channels before reading the total. TOIF covers developer-owned interconnection equipment, Physical NU covers local network modifications, and SR NU covers shared PJM-system work triggered when aggregate generation pushes transmission past thermal limits. Affected System costs cover upgrades on neighboring systems. Across TC1, the non-SR channels barely moved. TOIF median change was -$175,000 and Physical NU was effectively zero. Affected System costs materialize late by design for 47 of 83 survivors, with $60.7M total. SR NU median change from Phase I to Final SIS was -$4,373,036, a 71.9% reduction.
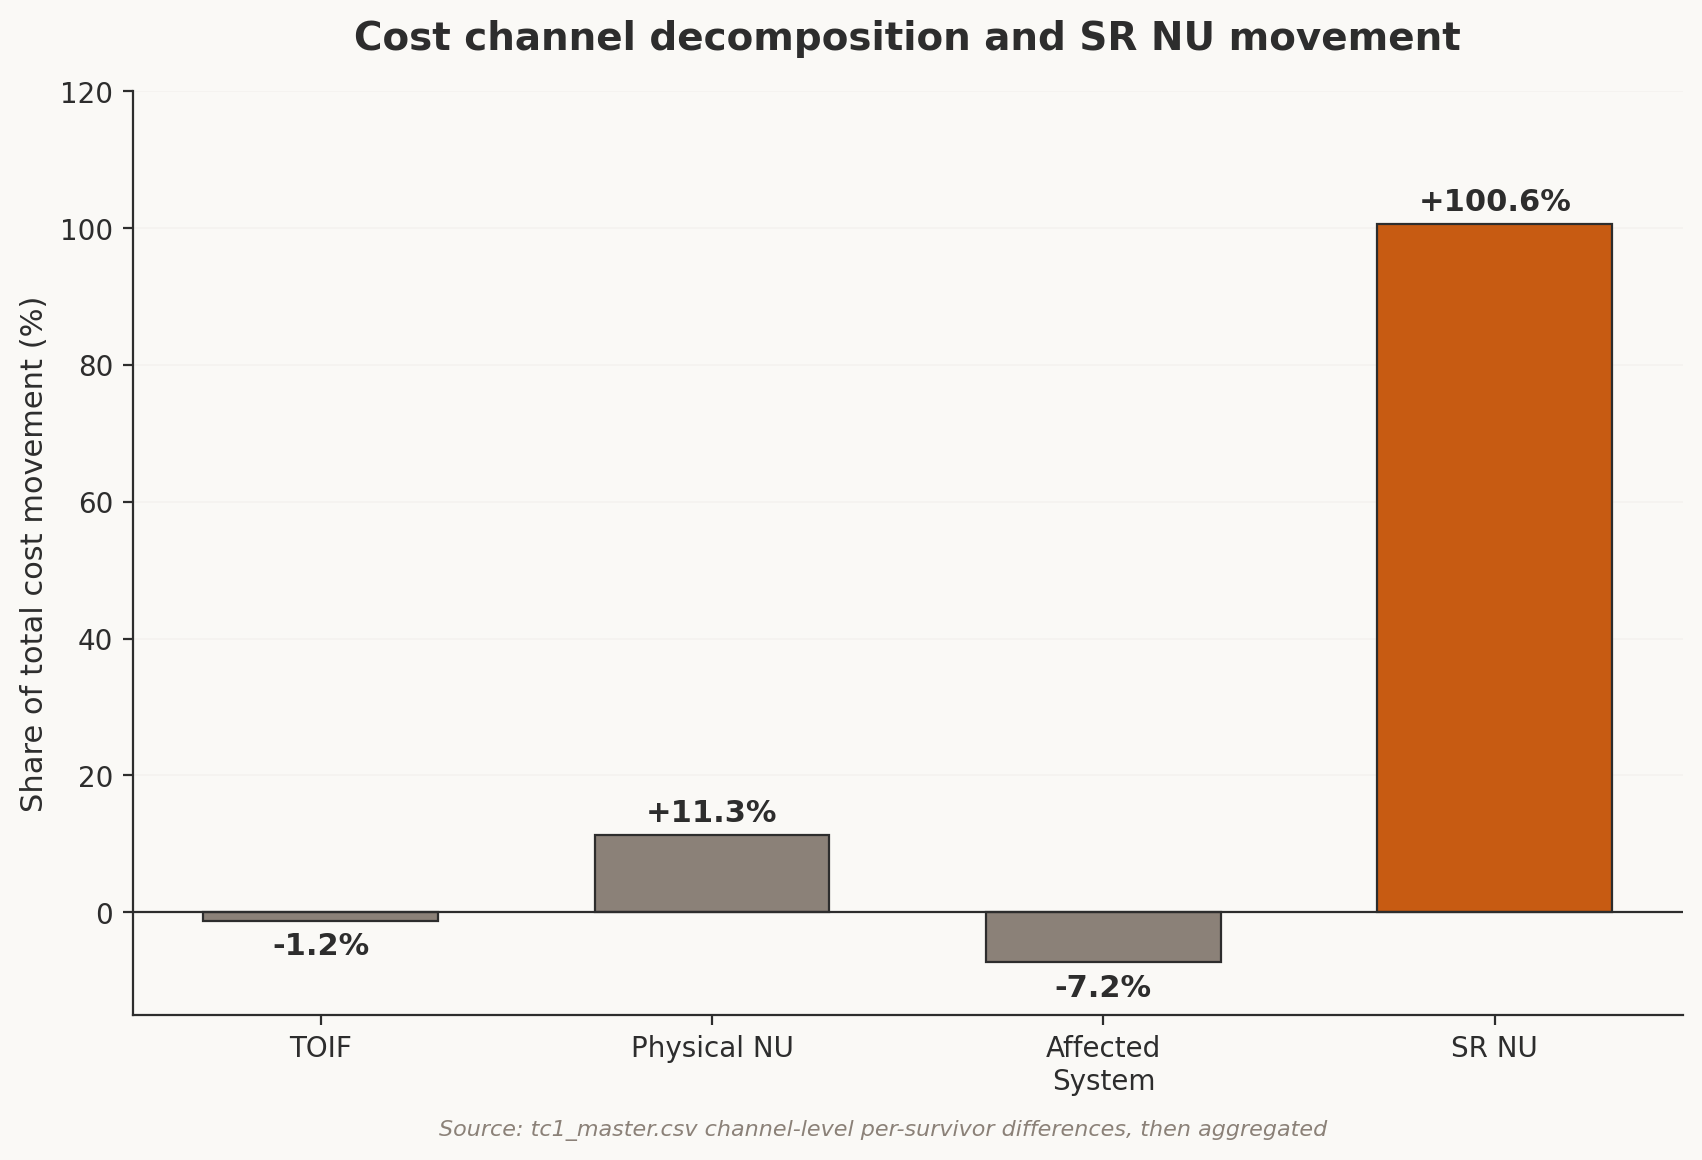
One channel accounts for 100.6% of all cost movement. The other three net slightly positive.
System Reliability Network Upgrades account for 100.6% of total cost change across all TC1 survivors. The other channels net slightly positive, so SR NU overexplains the total. The overshoot is real. Neighbor behavior moves SR NU more than the project's own equipment or site characteristics.
The other three channels mostly stay with the project itself. TOIF tracks the developer's own equipment, which usually stays stable between study phases. Physical NU tracks the local connection scope, which shifts only when the transmission owner's facility-level engineering revises it, and the revisions are small relative to total cost. SR NU follows cluster composition because its thermal triggers fire or clear based on aggregate loading.
Put the SR NU share on the first page of the cost read. Neighboring projects, thermal triggers, and restudy outcomes determine that share. The developer controls the site and the interconnection request. The cohort helps determine the shared bill.
AEP aggregate SR NU compressed by 95.8%, the strongest compression of any TC1 territory. AEP-Indiana was 94.7%. At first glance, that seems to conflict with the late-killing, backbone-burdened AEP frame. The populations are different. Extreme SR NU compression at SIS means the survivors got their reinforcement bills cut sharply after enough neighbors left to push aggregate loading below thermal triggers across most of the AEP scope. The 17 AEP survivors inherited a much smaller SR NU bill than they entered with. The 29 non-survivors were gone before that relief arrived.
Both populations exist in the same territory. They belong on different y-axes. AEP can show aggregate compression and survivor burden at the same time.
Both ComEd and AEP exhibit the threshold process operating through PJM's Power Transfer Distribution Factor (PTDF) allocation, the methodology that distributes shared reinforcement costs across all generators that contribute to a thermal violation. Each reinforcement has a thermal trigger, a specific megawatt loading level on a specific transmission element above which the reinforcement is required. The trigger is a step function with a binary study result. Loading below the thermal limit clears the item. Loading above the thermal limit requires the full reinforcement.
When projects withdraw, their PTDF contributions to the constrained element disappear. If enough neighbors withdraw to push aggregate loading below the trigger, the reinforcement can fall out of that study round's allocation. The study treats the trigger as a cleared-or-required condition. That binary behavior explains the size of SR NU movement.
Dominion SR NU moved from 58% of Phase I to 58% of Final SIS, a +3.3% change that is functionally zero. Dominion's transmission corridors are deeply enough constrained that withdrawal volume in TC1 failed to push loading below the thermal triggers. The remaining reinforcements are structurally needed corridor work with less sensitivity to cluster size. That variable separates compression in ComEd and AEP-Indiana from persistence in Dominion.
A Phase I to Final SIS comparison blends four channels. Three usually move little. SR NU is the channel to isolate because every other project sharing the same constrained transmission elements can change it. When costs move that much, the initial cost letter gives the fund a starting number before the survival answer exists.
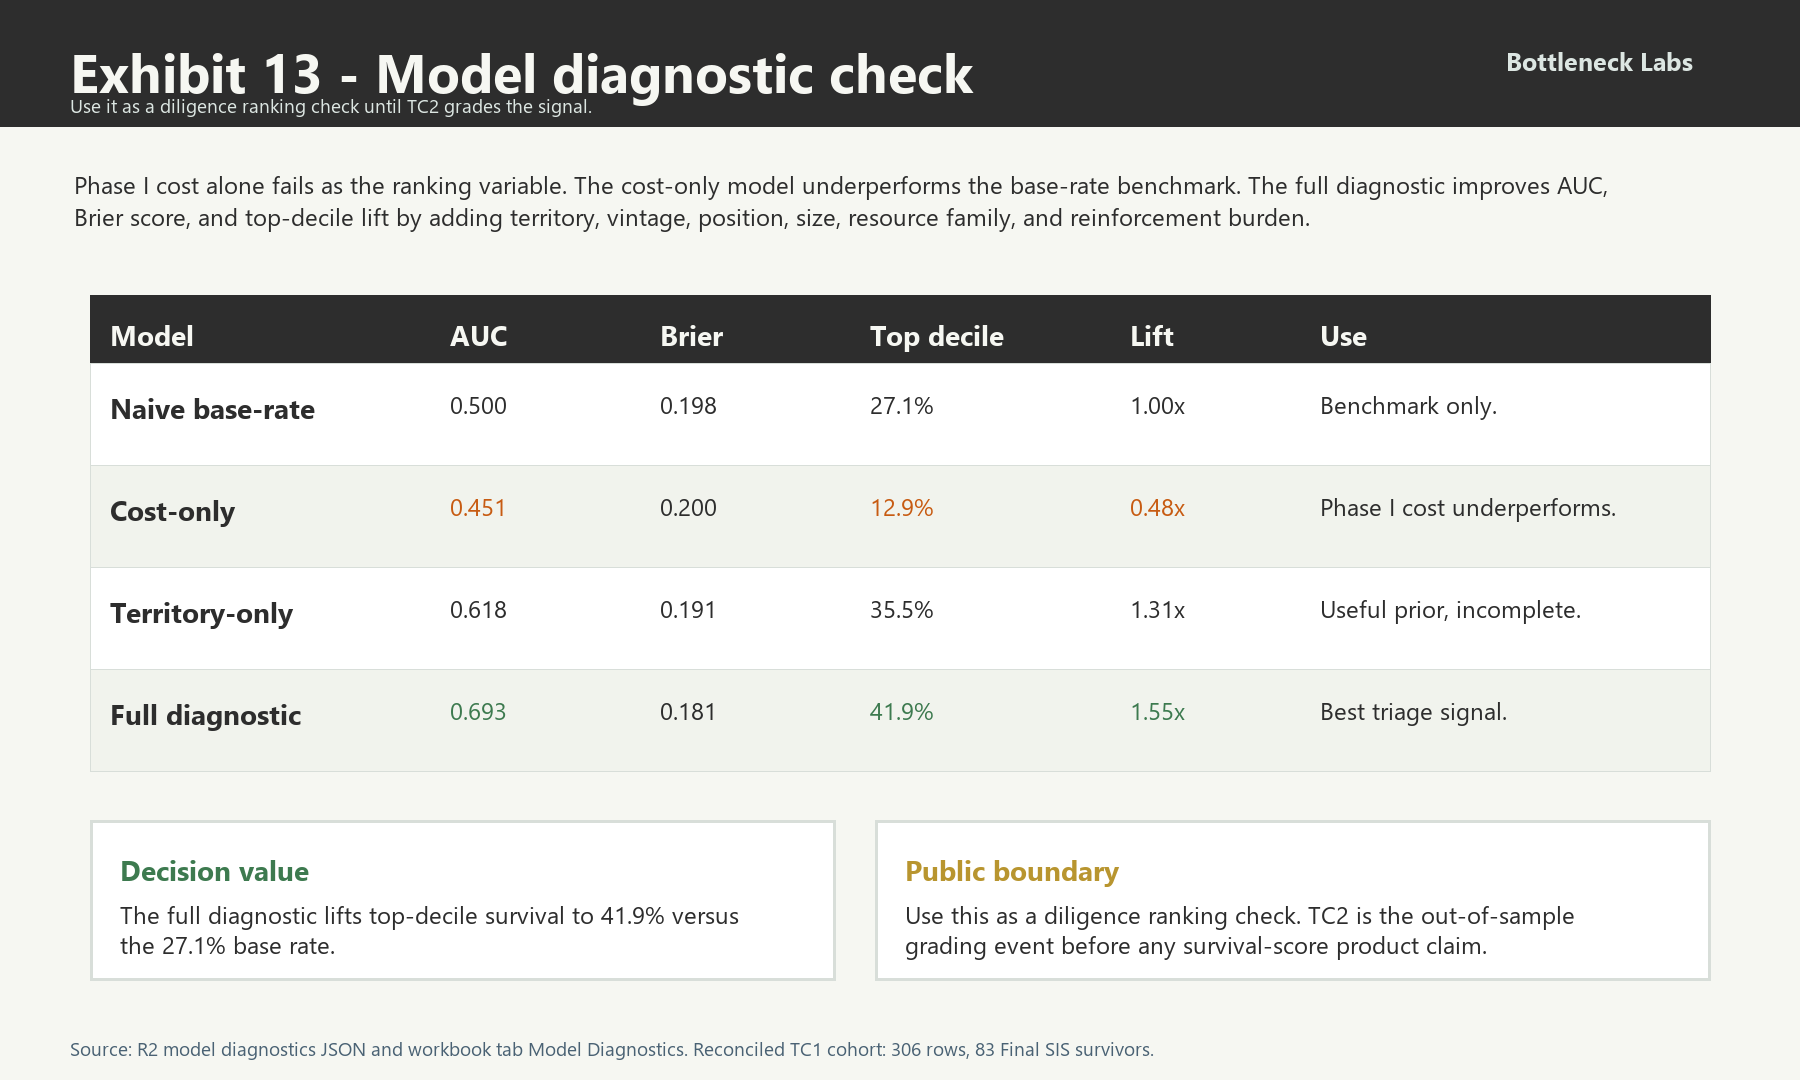
Phase I total cost distributions for survivors and non-survivors are statistically identical. Mann-Whitney p = 0.698. The medians are $21.1M (survivors) and $21.8M (non-survivors). The logistic regression used 11 features. Territory and vintage were in that feature set. Size, resource type, and reinforcement count were included as well. Phase I cost has an odds ratio of 0.832 with p = 0.871.
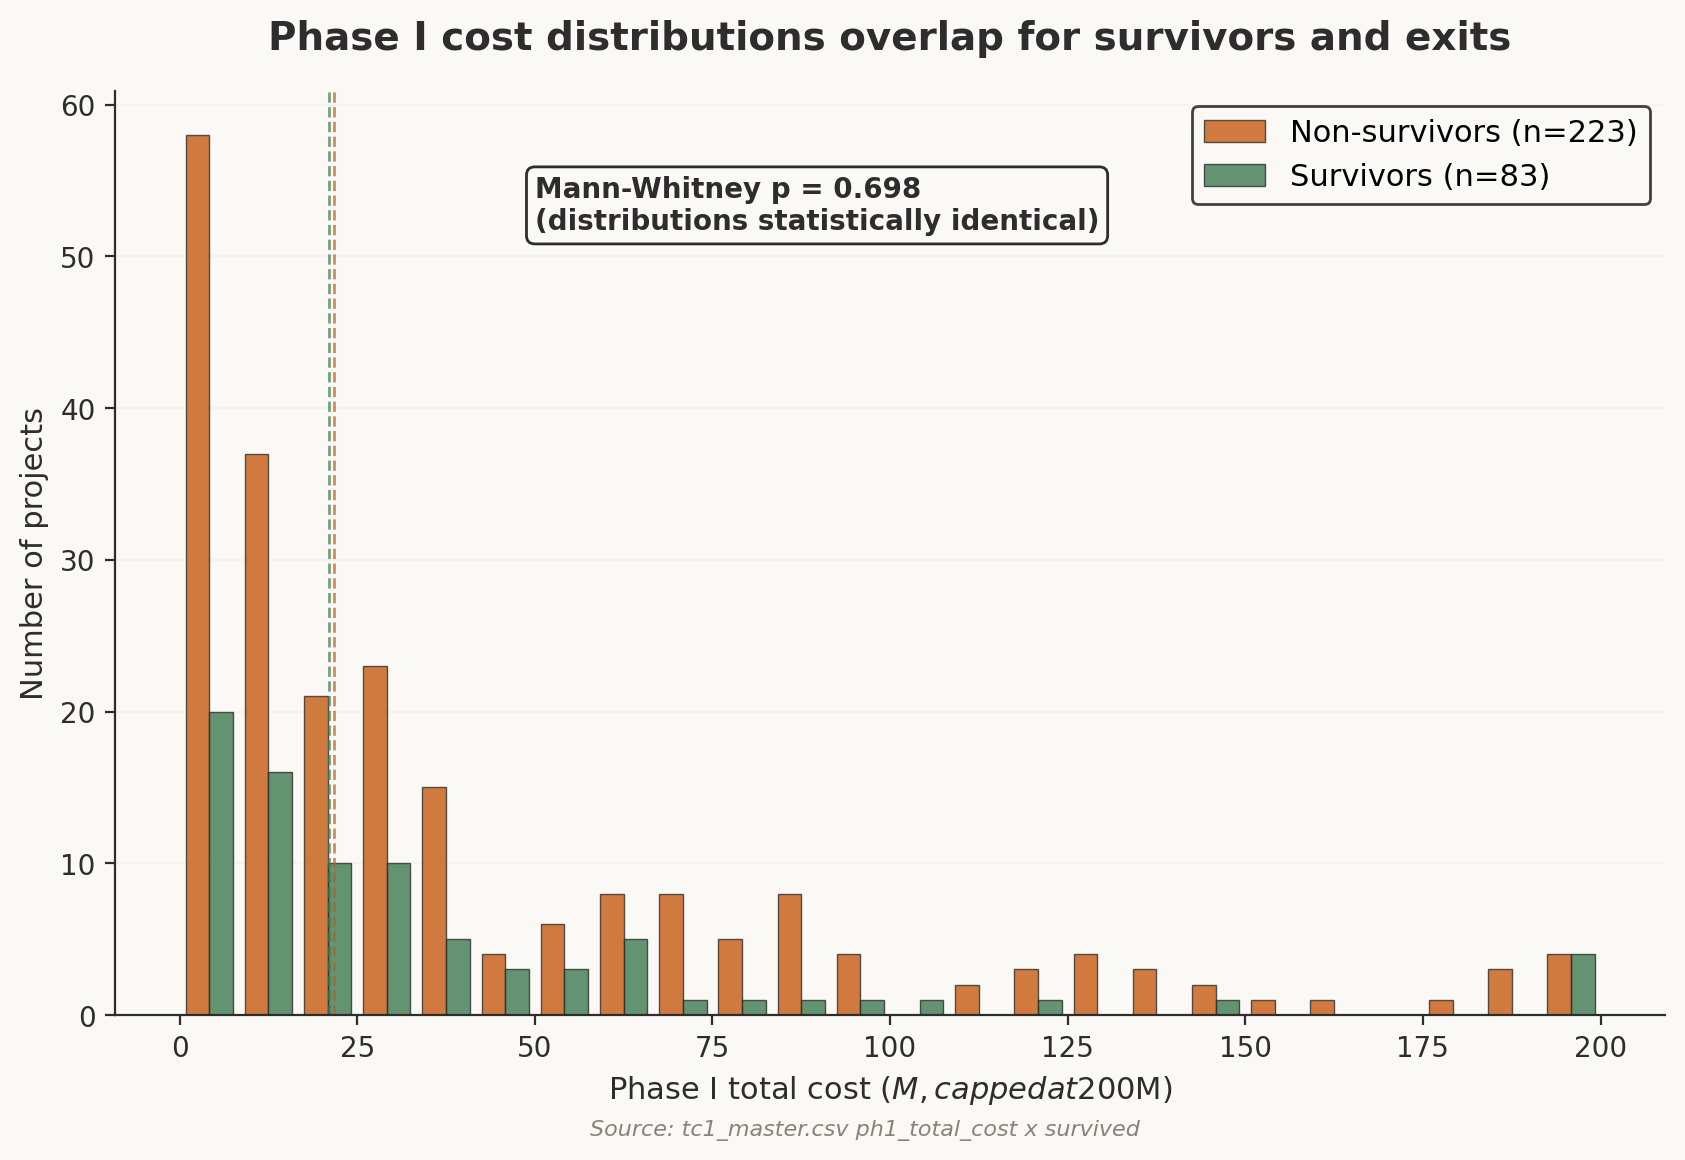
Nearly identical distributions. Mann-Whitney p = 0.698. The initial cost letter is the first draft of the underwriting number.
The finding is easy to misread. Developers do make cost-based withdrawal decisions. When a retooled study result arrives materially above the original Phase I estimate, developers with thin margins can walk. Individual withdrawal decisions are often cost-driven. Phase I cost levels simply failed to separate the projects that eventually survived from the projects that eventually died. The cost that mattered arrived later, after the cluster reshuffled.
The distributions overlap almost completely. Survivors had a median Phase I cost of $21.1M. Non-survivors had a median of $21.8M. The means diverge slightly ($48.0M vs $41.1M for survivors vs non-survivors), driven by a handful of very large projects that survived. Neither measure provides discriminating power.
Initial cost fails because the Phase I number is a snapshot of a moving allocation. Costs shift as neighbors withdraw, thermal triggers clear or persist, and fixed reinforcement costs concentrate on the cohort that remains. A project assigned a large Phase I reinforcement bill might see that number fall sharply by Final SIS if enough neighbors withdraw and trigger threshold elimination. It might also see the bill climb if it sits in a corridor with persistent reinforcements and a shrinking denominator of remaining projects.
Look at the same dollar letter in two places. In one corridor, neighbor withdrawals can clear a trigger and cut the shared bill. In another, the backbone work remains and fewer surviving projects bear it. Vintage, territory, and POI decide which version of the cost letter the project is living inside.
For diligence, the first page changes. A fund evaluating an interconnection-stage project should replace the Phase I cost anchor with SR NU share and territory. Vintage cohort and POI cluster composition belong on the same page. A high SR NU ComEd project may be more financeable than a lower headline-cost Dominion project if the ComEd exposure is tied to volume-sensitive reinforcements and the Dominion exposure is tied to backbone work.
A Phase I number can feel precise because it arrives with dollars and decimals. The precision is premature. The memo needs to ask how much of that number sits in shared-network exposure. It also needs to ask which future study document will reprice the exposure.
Start the diligence read with SR NU share and reinforcement lineage. Then check the POI/substation cluster and neighbor status. Finish with the territory prior, vintage cohort, and next PJM document that will reprice or grade the exposure. A cost letter without those fields is only a first draft of diligence.
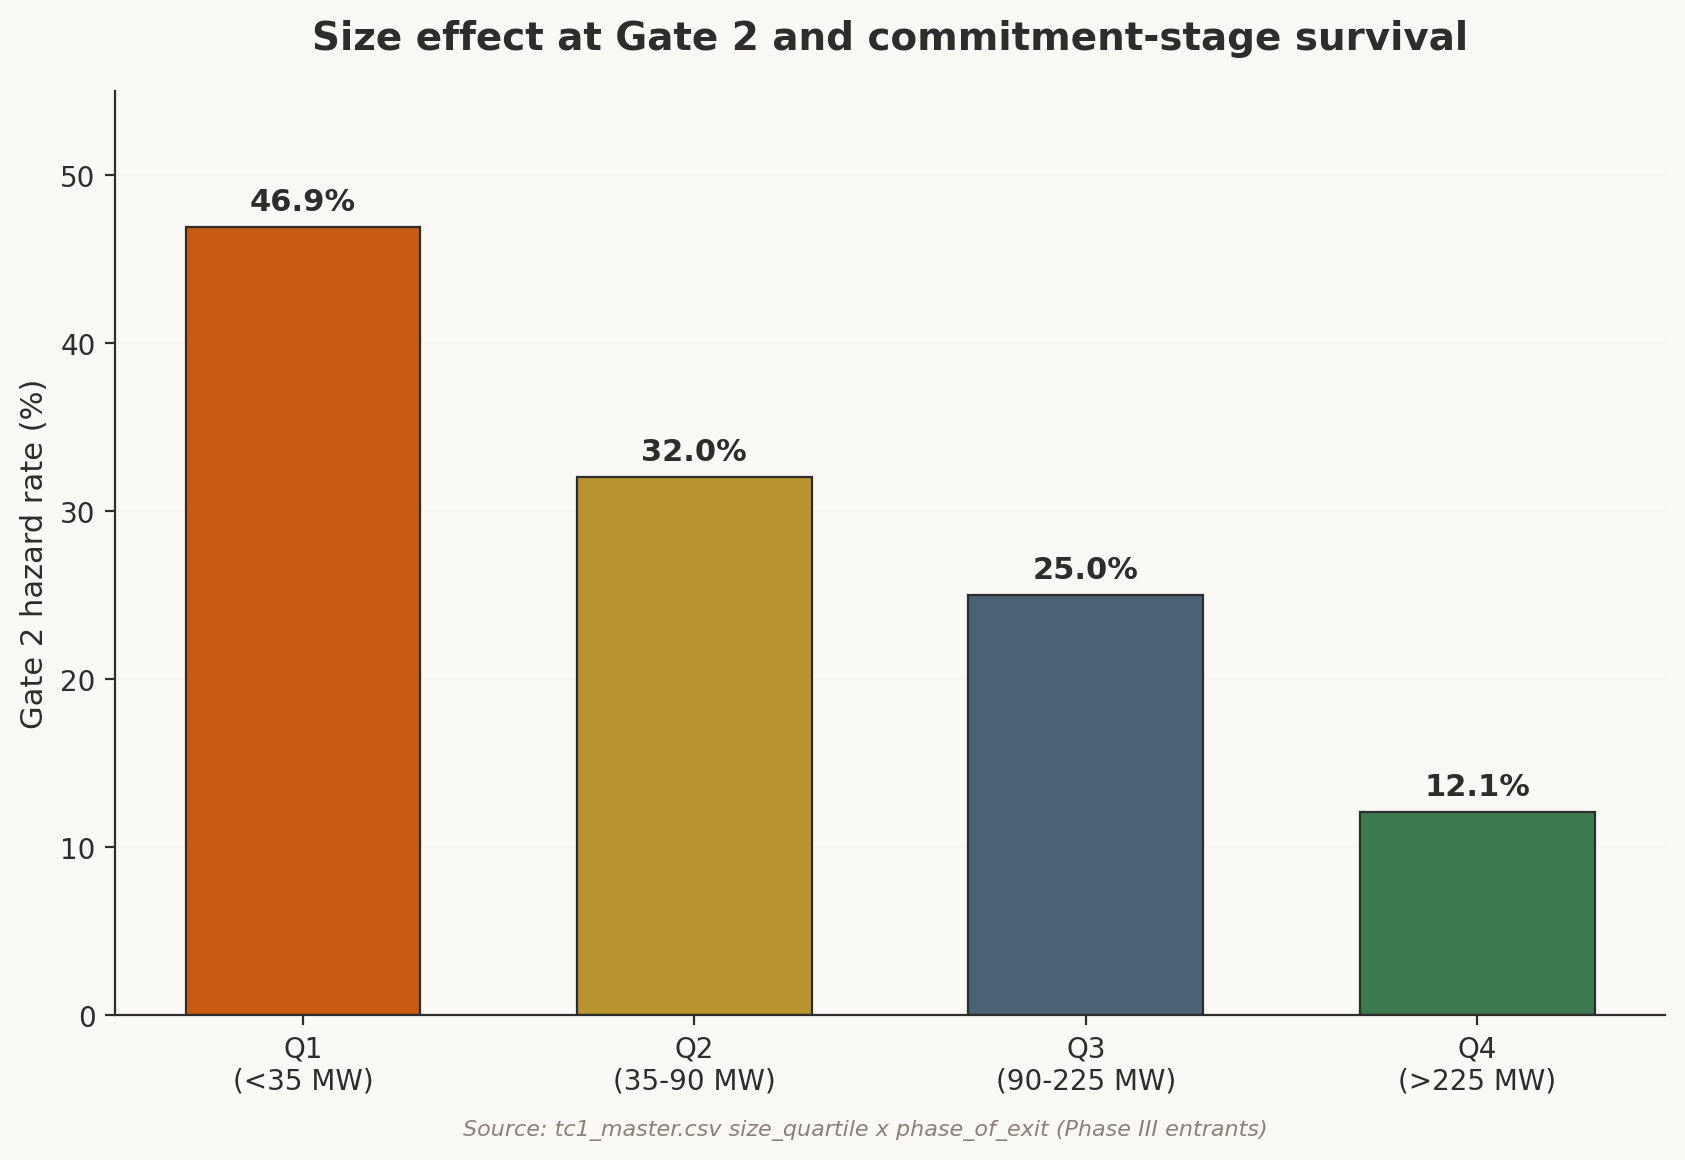
Q4 projects (>225 MW) face 12.1% hazard at Gate 2. Q1 faces 46.9%. Size helps at the commitment stage.
Size changes the final gate. Projects in the largest quartile, Q4 above roughly 225 MW, face a 12.1% hazard at Gate 2. The smallest quartile faces 46.9%. Large projects that reach Phase III almost always reach Final SIS. At early gates, size provides no advantage. The selection at early gates is driven by the cost environment, which affects projects regardless of scale. At the final gate, the developer's balance sheet and commitment level become decisive.
A large late-stage project with more capital, land control, and commercial work already committed has more reason to absorb a cost shock than a smaller project with fewer sunk commitments. The final gate selects partly on sponsor capacity and commitment level. Size becomes useful only after the project has survived the earlier allocation screens.
The size gradient varies by resource type. Solar shows a positive gradient, with Q1 survival at 19.6% and Q4 at 50.0%. Storage inverts it. Large storage projects die at higher rates than small ones, with Q1 at 35.0% and Q4 at 15.8%. The inversion sits outside the solar size story and is flagged for a dedicated later release.
The vintage data has one obvious confound. Older projects had years of development time before entering the cluster study. They may have secured stronger financing, locked site control agreements, and negotiated offtake arrangements that made them more resilient to cost shocks. The vintage effect could reflect maturity alongside position.
The within-territory test keeps that caveat bounded. It holds the transmission owner constant, then asks whether AG1 still underperforms older projects. The answer is strongest in Dominion.
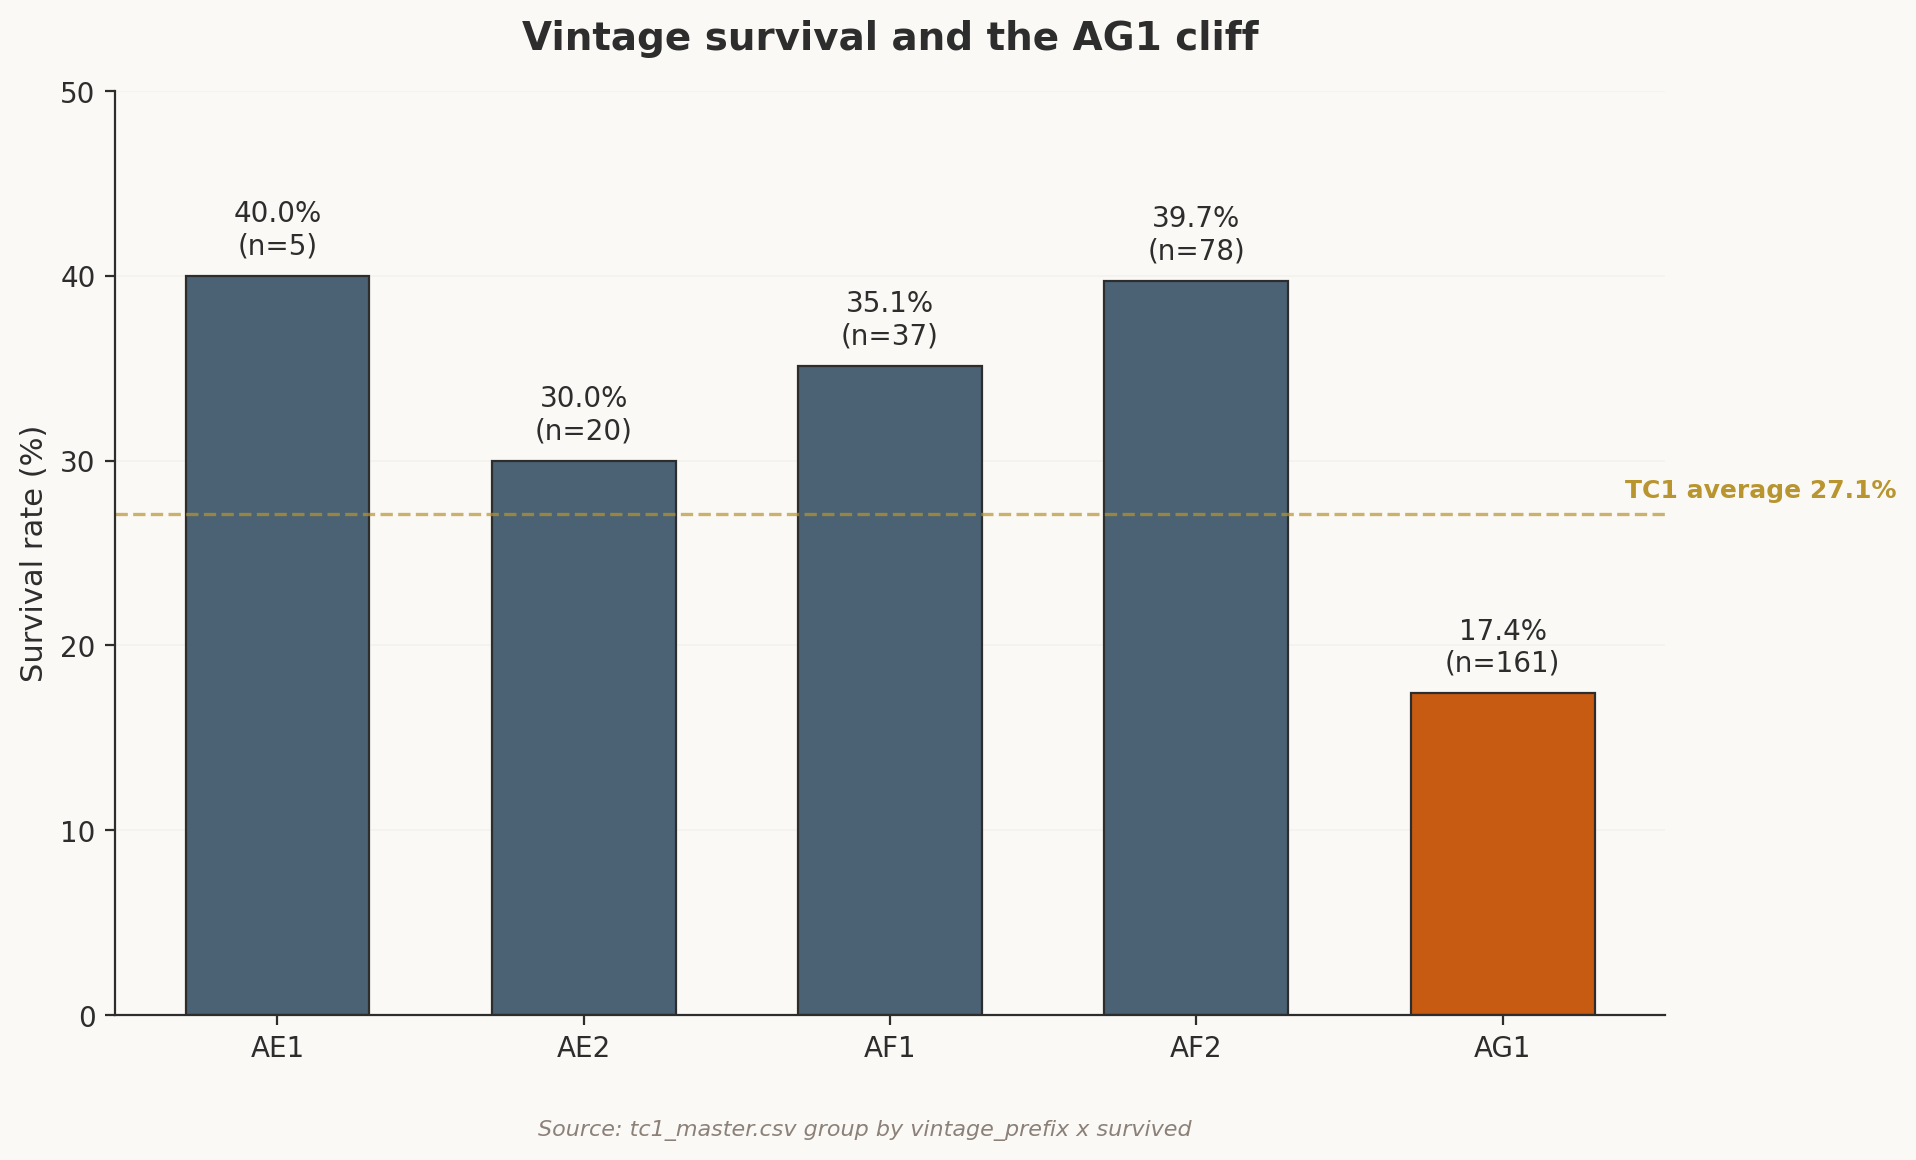
AE1 through AF2 cluster at 35-40%. AG1 falls off a cliff to 17.4%. The queue tolerates entrants until the saturated cohort arrives.
AE1 survival was 40.0% (n=5). AE2 was 36.0% (n=25). AF1 was 35.1% (n=37). AF2 was 39.7% (n=78). The first four vintage cohorts cluster between 35% and 40%, as if queue entry timing were irrelevant. Then AG1 fell to 17.4% (n=161). The largest cohort by a factor of two became the cliff.
AG1 vintage is the strongest single predictor in the full regression model, with OR 0.323 and p < 0.0001. It is stronger than any territory indicator and the only vintage indicator that survives FDR correction, with p = 0.0014. A smooth gradient where each successive vintage does marginally worse would suggest a pricing effect in which each additional MW costs a bit more to accommodate. TC1 shows something harsher. The queue tolerates entrants until a structural threshold, then the last cohort absorbs the saturated system. The cliff implies capacity saturation. The study process runs out of room to allocate reinforcement costs without triggering cascading withdrawals.
AG1 projects entered when the queue was most congested. They sat at the end of the longest shared-dependency chains, exposed to the most neighbors, bearing the highest marginal reinforcement burden. Their Phase I costs were similar to other cohorts. The cost-irrelevance finding holds within AG1 as well. They were positioned where the most withdrawal-driven cost reshuffling would occur.
At every gate, AG1 projects face hazard rates above 40%. No other vintage exceeds 40% at any single gate. The hazards stack. Gate 0 is 41.0%, Gate 1 is 49.5%, and Gate 2 is 41.7%. An AG1 project entering Phase I has a roughly 1-in-6 chance of emerging alive. That is descriptive before it is causal. The public PJM file lacks developer-level maturity fields such as financing or offtake, so the causal claim stays narrow.
Being AG1 in Dominion compounds to a 10.1% survival rate, compared to 39.5% for pre-AG1 Dominion projects (p = 0.0003). This is the worst intersection in the entire dataset. The interaction is more than additive. Both factors independently predict death, and together they create a near-complete elimination zone.
The within-territory data constrains the maturity interpretation. AG1 within Dominion survives at 10.1%. Pre-AG1 Dominion projects survive at 39.5%. The test holds the transmission owner and broad grid regime constant, then asks whether the late cohort still underperforms. It still leaves developer maturity open. Developer-level financing, offtake, and site-control data would be needed for that.
The mix-only check narrows the escape hatch further. Across eight simple reweighting tests, expected AG1 survival stays between 35.9% and 38.4%. Actual AG1 survival is 17.4%. The residual gap is roughly 18 to 21 percentage points. Cause remains open. A one-dimensional mix explanation becomes hard to sustain.
The positional explanation is the strongest working read of the available signal, with causal isolation still open. AG1 within ComEd shows the same direction, 25.0% versus 48.8% for pre-AG1, though the smaller sample (n=24) produces p = 0.072. The pattern replicates across territories, which weakens the claim that AG1 only landed in worse territories. AG1 should therefore be used as a position-exposure signal, with the transfer claim kept narrow until TC2 grades it.
TC2 tests the causal story directly. If AG2 and AH1 vintages show similar cliff behavior despite different market conditions and different financing environments, the positional explanation strengthens. If newer-vintage TC2 projects survive at rates above 17.4%, the maturity interpretation gains ground. One early signal is already in. TC2 mid-cycle data breaks the smooth vintage monotonicity visible in TC1. Whether that reflects a cycle-specific cohort artifact, a regulatory regime change, or a falsification of the positional story is the live TC2 adjudication.
Territory-level survival rates hide the thing a developer actually chooses. The mean absolute deviation between a POI's survival rate and its territory rate is 34.2 percentage points. Two projects in the same territory, connecting to substations twenty miles apart, can face different survival regimes.
Forty-nine multi-project POI clusters exist in the TC1 data. A cluster is a set of projects targeting the same substation or interconnection point. Thirty-one are kill zones with 0% survival among all clustered projects. Eleven are safe harbors with 100% survival. Seven show mixed outcomes that the territory average would never predict.
Within Dominion, 22 of 23 multi-project POIs deviate from the territory average by more than 20 percentage points. Within ComEd, 10 of 13 do. Within AEP, 8 of 8 do. The territory rate is an average that almost no individual substation matches.
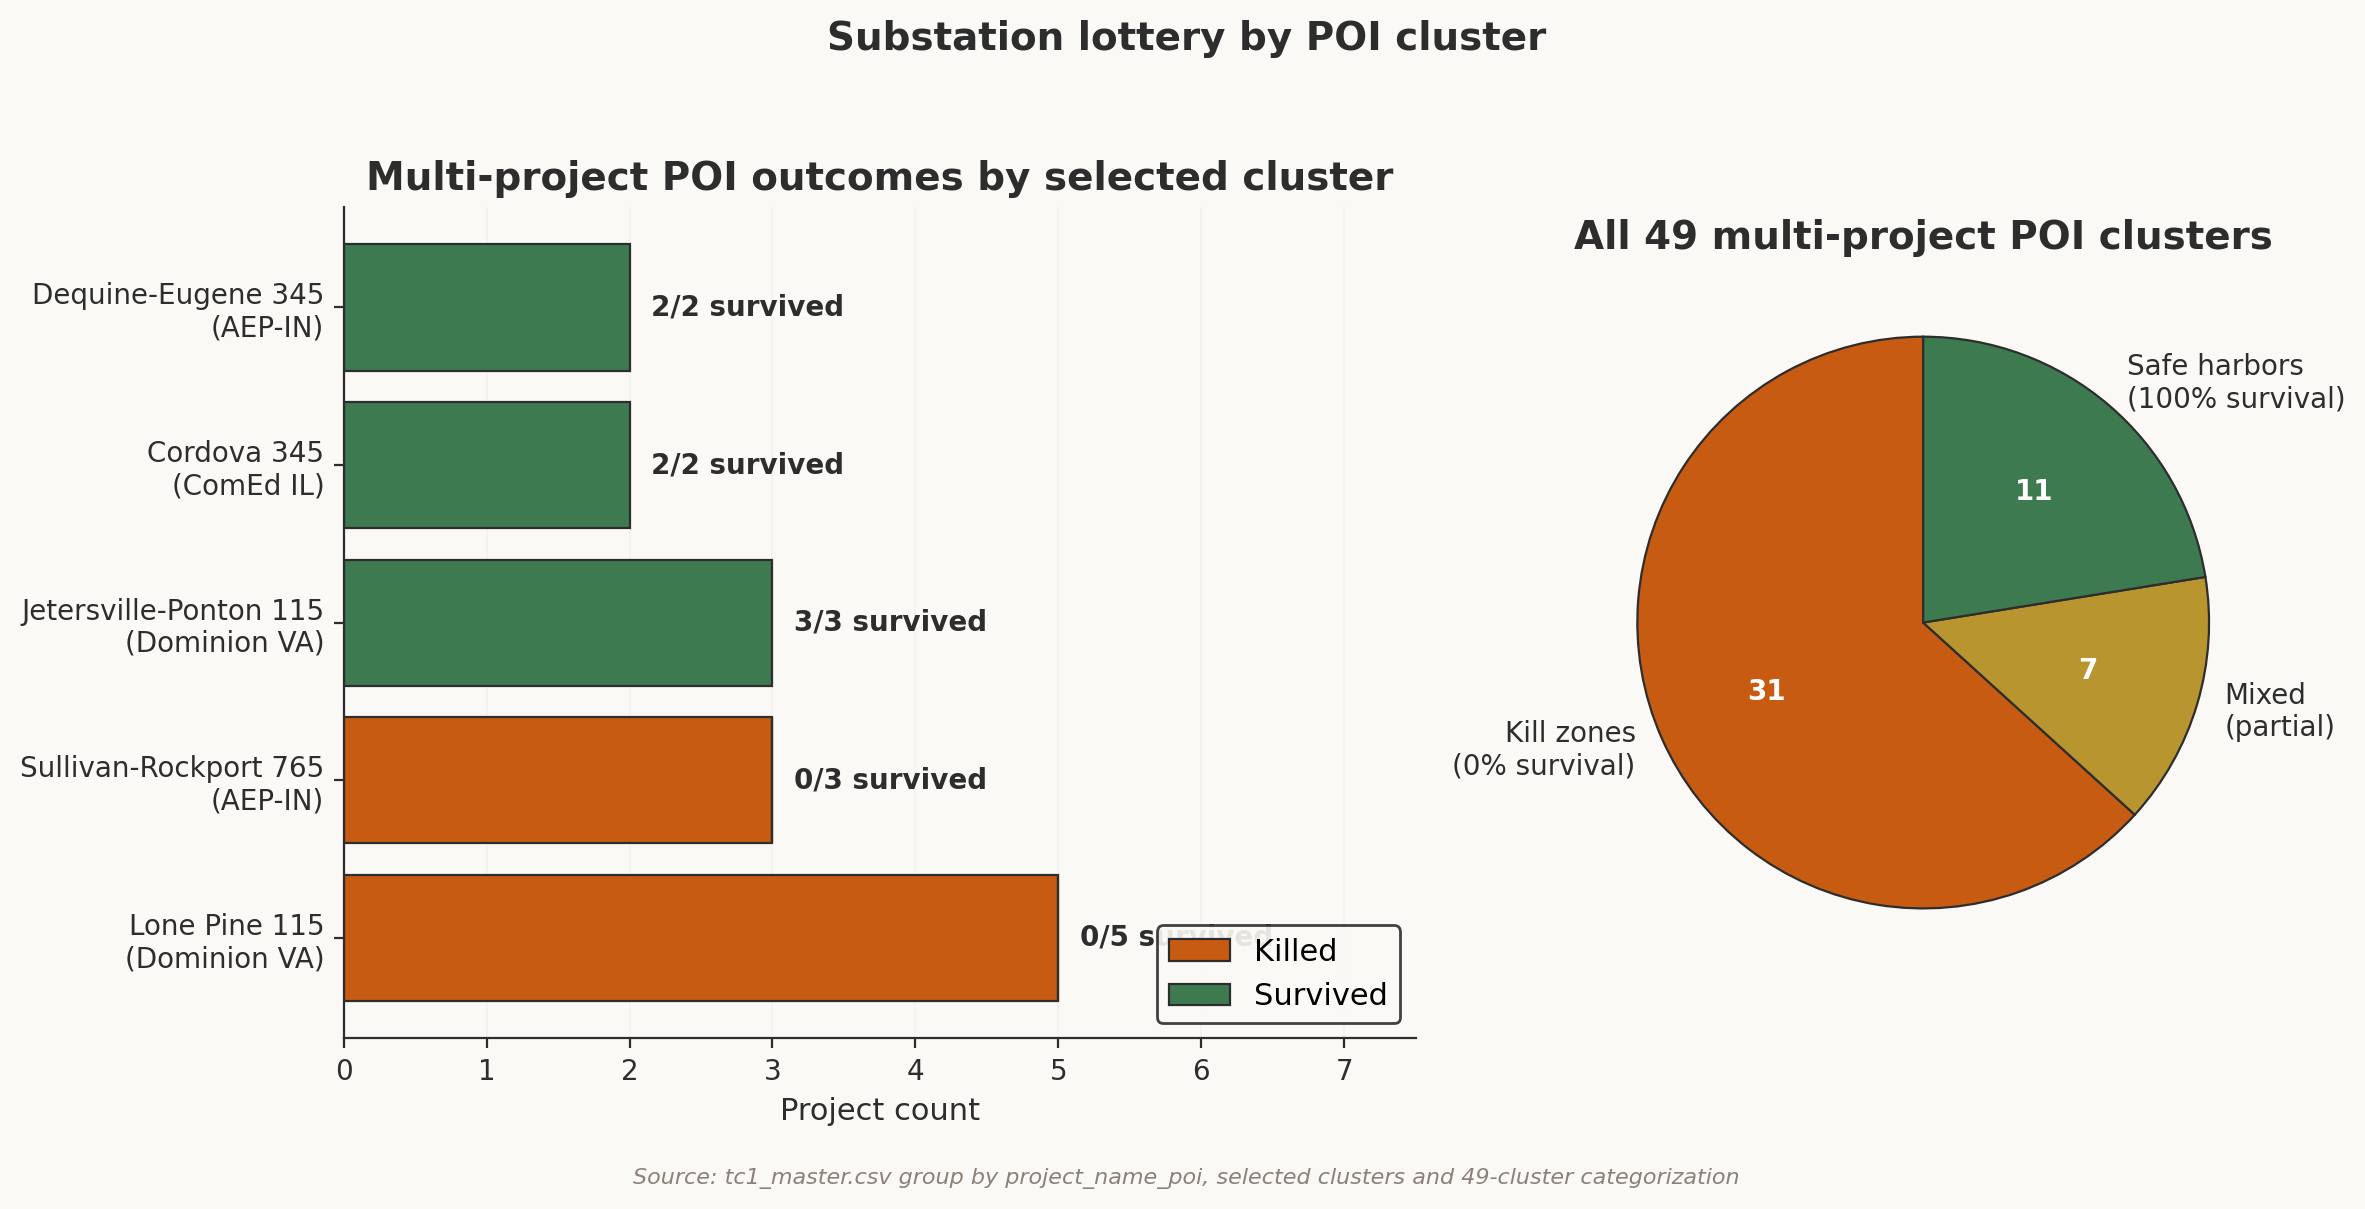
Lone Pine 115 kV had 5 projects, all killed at the same gate, with identical $7.998M allocations. The substation is the unit of exposure.
Two Dominion substations in rural Virginia illustrate the spread. Lone Pine 115 kV, a radial feeder POI, attracted five TC1 projects in the AG1 family clustered at that POI. All five received identical Phase I cost allocations of $7,998,807. PJM's PTDF allocation distributes shared reinforcement scope across projects with shared electrical impact. All five died between Phase III and Final SIS. Jetersville-Ponton 115 kV, roughly 60 miles southwest, attracted three projects. All three survived.
Same transmission owner, same state, opposite outcomes. The voltage and topology differ. Lone Pine sits at the end of a thermally constrained path requiring backbone reinforcement. Jetersville-Ponton connects near a well-meshed section of the 230 kV network with available headroom.
The pattern extends across territories. Sullivan-Rockport 765 kV in AEP-Indiana attracted AE2-130 at Rockport plus AF1-088 and AF2-008 at Sullivan. All three were killed before Final SIS with backbone-grade allocation exposure. Cordova 345 kV in ComEd attracted AG1-462 and AG1-553, and both survived. It had the same vintage as the AG1 cohort that fell off the cliff in Dominion and the same large-project profile. The difference was a well-connected node where threshold elimination cleared costs and avoided concentration. The vintage cliff is real, and it is position-conditional.
Reinforcement costs are allocated based on the electrical impact of generation at a specific interconnection point. Two substations in the same territory can have entirely different thermal constraints and reinforcement requirements. A substation at the end of a long radial feeder triggers expensive backbone upgrades. A substation near a well-connected hub triggers modest local work. The territory label hides the variation.
A developer told "ComEd survives at 40.3%" is receiving a number that describes none of the 13 multi-project ComEd POIs accurately. Within-territory variance exceeds between-territory variance, which means substation-level predictions are possible. The reinforcement burden that determines survival concentrates at specific substations where the grid's physical constraints create bottlenecks. Those bottlenecks are visible in Phase I study data before a developer commits more capital.
A developer choosing between two substations in the same territory faces a decision with more survival-rate variance than a developer choosing between two territories. A developer choosing between a kill-zone substation in ComEd and a safe-harbor substation in Dominion may find better odds at the Dominion site, despite the territory-level statistics pointing the opposite direction. The substation lottery is where the forensic reconstruction becomes operationally useful.
In ComEd and AEP-Indiana, the threshold process can operate as a release valve. Withdrawals reduce aggregate loading, remove some reinforcements from the study allocation, and let survivors inherit a cheaper cost allocation. The queue filters down to an equilibrium where the remaining infrastructure bill is easier to finance. Dominion follows a different rule.
Dominion's SR NU costs hold steady at +3.3% from Phase I to Final SIS. The reinforcements persist in a different way from ComEd's volume-sensitive scope. The discount factor is 0.26, meaning 74% of Dominion's original topology cost baseline was eliminated. The threshold process did operate on the cheap, volume-sensitive reinforcements. The 26% that remains is non-compressible. The remaining reinforcements are backbone infrastructure serving corridors where the thermal violations are less sensitive to how many projects share the queue.
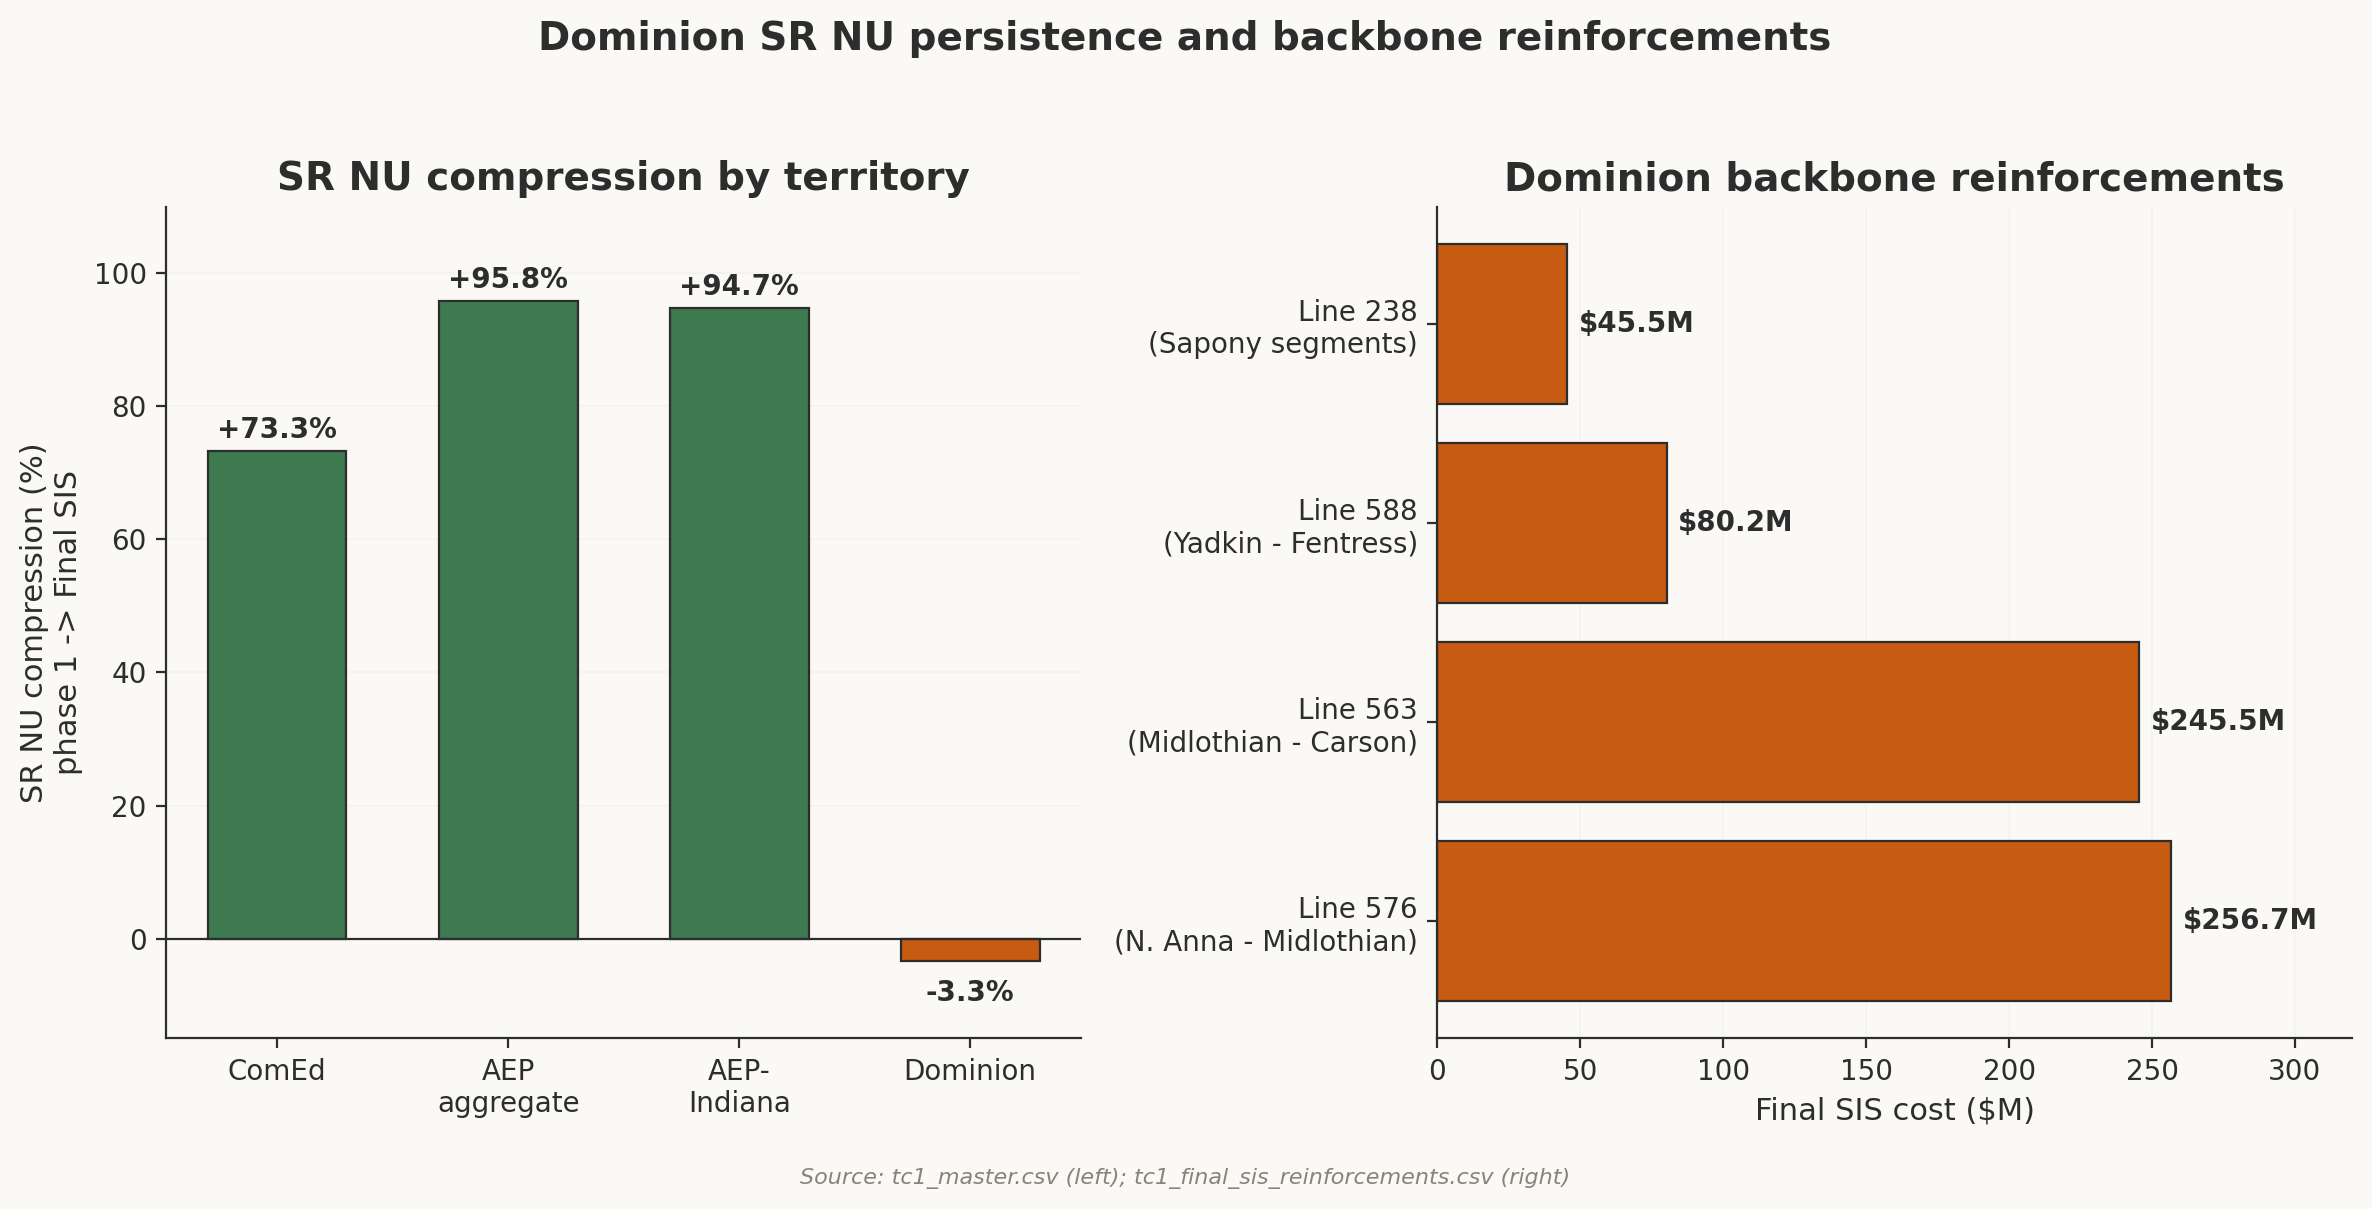
SR NU holds at +3.3% from Phase I to Final SIS. The backbone persists because the constraints are genuine.
The Piedmont-to-Tidewater corridor illustrates the physics. Generation in western Virginia must travel east through long, thermally constrained transmission corridors to reach the Hampton Roads and Richmond load centers. The 500 kV system connecting these points is meshed, and under N-1 contingency conditions the alternative paths are thermally inadequate. Adding generation at the western end creates a corridor problem because every megawatt produced must travel the full distance from generator to load.
Line 563 is the reinforcement that defines Dominion's cost story. It is 37.41 miles of 500 kV between the Midlothian switching station and Carson. The Final SIS cost was $245.5 million under RTEP n9139.0, and the same physical family reappears in TC2 Phase I. Dominion's 230 kV line 238 adds a smaller confirming case. Two consolidated segments total $45.5 million at Final SIS, and both reappear in TC2. The evidence rests on line items, separate from a territory average. The line items show the backbone family surviving from a completed cohort into the next study cohort.
Geography explains why those line items are hard to compress. Existing right-of-way follows constrained routes through central Virginia. Wreck-and-rebuild means replacing structures and conductors on the same corridor, separate from a small local equipment swap at the POI.
Final SIS cost was $245,455,768, with RTEP ID n9139.0. It is a single reinforcement with a single tracking number, and its recurrence risk remains high when later project mixes stress the same corridor. Line 563 becomes a physical object in the TC2 recurrence test.
Line 238 follows the same logic at a lower voltage class. It is a multi-segment 230 kV rebuild from Sapony through AE2-033 Tap to Clubhouse, totaling roughly 16 miles of conductor work. Phase I scope was three contingent segments totaling $66.2M (segments at $17.7M, $7.5M, and $41.1M). Final SIS scope was two consolidated segments totaling $45.5M. The consolidation reduced the dollar figure and kept the work alive. Both Final SIS segments appear in TC2's Phase I docket, allocated to a new generation of projects.
The AG1 x Dominion interaction, with 10.1% survival documented in Section V, persists at every gate because neither the vintage exposure nor the territorial cost burden lightens with time. The newest projects entered the longest shared-dependency chains in the most deeply constrained corridors. Each gate applies both filters simultaneously.
Dominion shows a queue that fails to filter its way to an affordable equilibrium. In a deeply constrained corridor, the surviving cohort still bears the backbone cost. The investors behind those projects face a specific problem. They survived the attrition, they committed the capital, and the infrastructure they are funding may still take 6 to 10 years to build. AEP-Indiana, with its Sullivan-Rockport 765 kV spine, operates under the same mode at a smaller scale. The geographic labels differ. The physics is the same.
Eighty-nine reinforcement line items appear in TC1's Final SIS. These are the infrastructure items that survived the four-phase study process, the grid work PJM's engineers determined was needed for the 83 Final SIS projects to interconnect. The next question is how many of those 89 reinforcements appear in TC2's Phase I study. The answer is 56, or 62.9%.
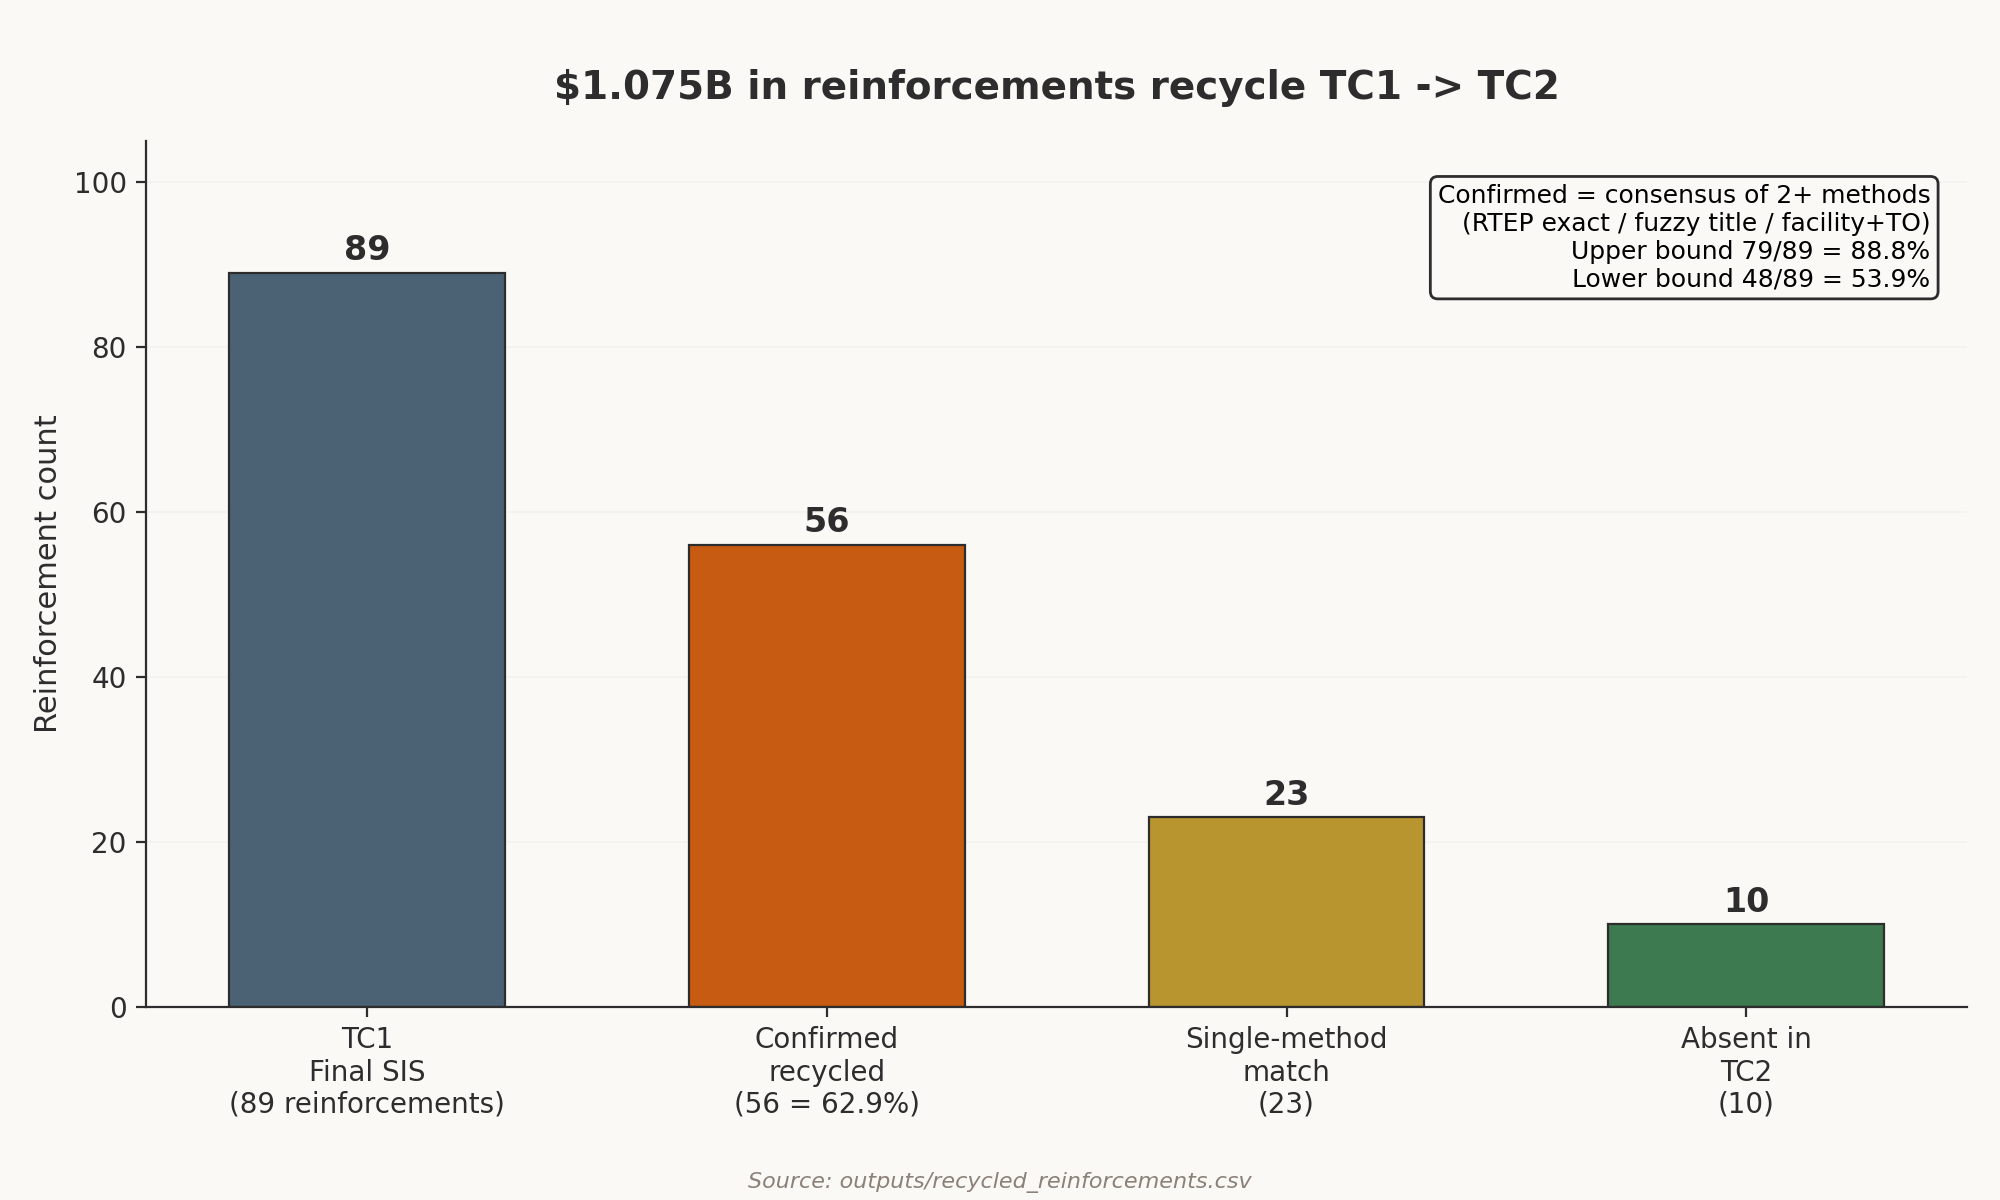
56 of 89 Final SIS reinforcements appear in TC2's Phase I study. $1.075B in infrastructure cycling through the queue.
The matching uses three independent methods. RTEP ID exact match, title-based fuzzy match with Jaccard similarity >= 0.5, and facility/segment plus transmission owner match. Fifty-six reinforcements are confirmed by consensus of two or more methods. Twenty-three additional reinforcements match on a single method only. Ten reinforcements appear actually absent from TC2.
The 56 confirmed recycled reinforcements represent $1.075 billion in estimated costs. Each item has an RTEP tracking number. The row also points to a substation, line segment, and cost estimate. Recurrence shows up as rows before it becomes a theme.
The recycling becomes concrete at the line-item level. Dominion's 500 kV line 563 between Midlothian and Carson, the 37.41-mile wreck-and-rebuild documented in Section VII, had a $245.5M Final SIS cost under RTEP n9139.0. It appeared in TC1's Final SIS assigned to specific TC1 projects. Those projects reached Final SIS, and the same reinforcement now appears in TC2's Phase I docket allocated to a new generation of developers. Dominion's 230 kV line 238 had two consolidated segments totaling $45.5M Final SIS, and both segments reappear in TC2. ComEd's L11212 345 kV reconductoring at $38.0M reappears as well.
The 23 flagged reinforcements, matching on only one method, show how reinforcement identity moves across cycles. A row can be retitled, split into multiple scope items, or absorbed into broader upgrade programs. The AEP b3775 family is illustrative. It is a cluster of sag mitigations and wavetrap upgrades on the Dumont-Stillwell 345 kV corridor that match TC2 on RTEP ID, with titles that shifted enough to fail fuzzy matching. The infrastructure is the same. The administrative packaging changed.
The 10 reinforcements outside the recycle bucket include the Wilton Center 765 kV bus reconfiguration in ComEd, the Fentress STATCOM installation in Dominion, and the Shawville transformer replacement in PENELEC. These were TC1-specific scope items tied to projects and loading conditions that cleared before TC2's study. The Fentress STATCOM is the cleanest example, a reactive power compensation device whose need was driven by a specific configuration of TC1 generation projects at nearby substations. When those projects withdrew, the voltage stability concern they created withdrew with them.
Twenty-five of the 56 confirmed recycled reinforcements are non-contingent, meaning directly required regardless of loading conditions. Thirty-one are contingent, meaning triggered by thermal or voltage violations that depend on which projects proceed. The contingent reinforcements are the highest-value watchlist candidates for recurrence because their triggers depend on future loading conditions and project mix.
$1.075 billion in grid work is circulating through the queue. TC1's developers paid to study this infrastructure and then largely abandoned it. TC2's developers are paying to study it again. When the same physical reinforcement family and transmission owner recur, the thermal violations that drove TC1's reinforcements can fire again. The same is true when voltage class and corridor exposure recur. Confidence is highest for the 25 non-contingent reinforcements. Those are required regardless of loading conditions. Confidence is lower for the 31 contingent reinforcements because they depend on which TC2 projects proceed.
The 10 non-recycled reinforcements remain worth tracking. They represent grid work the interconnection study process identified as needed and then removed from the strict TC1-to-TC2 recurrence bucket. Whether TC2 independently re-identifies any of them is a testable prediction.
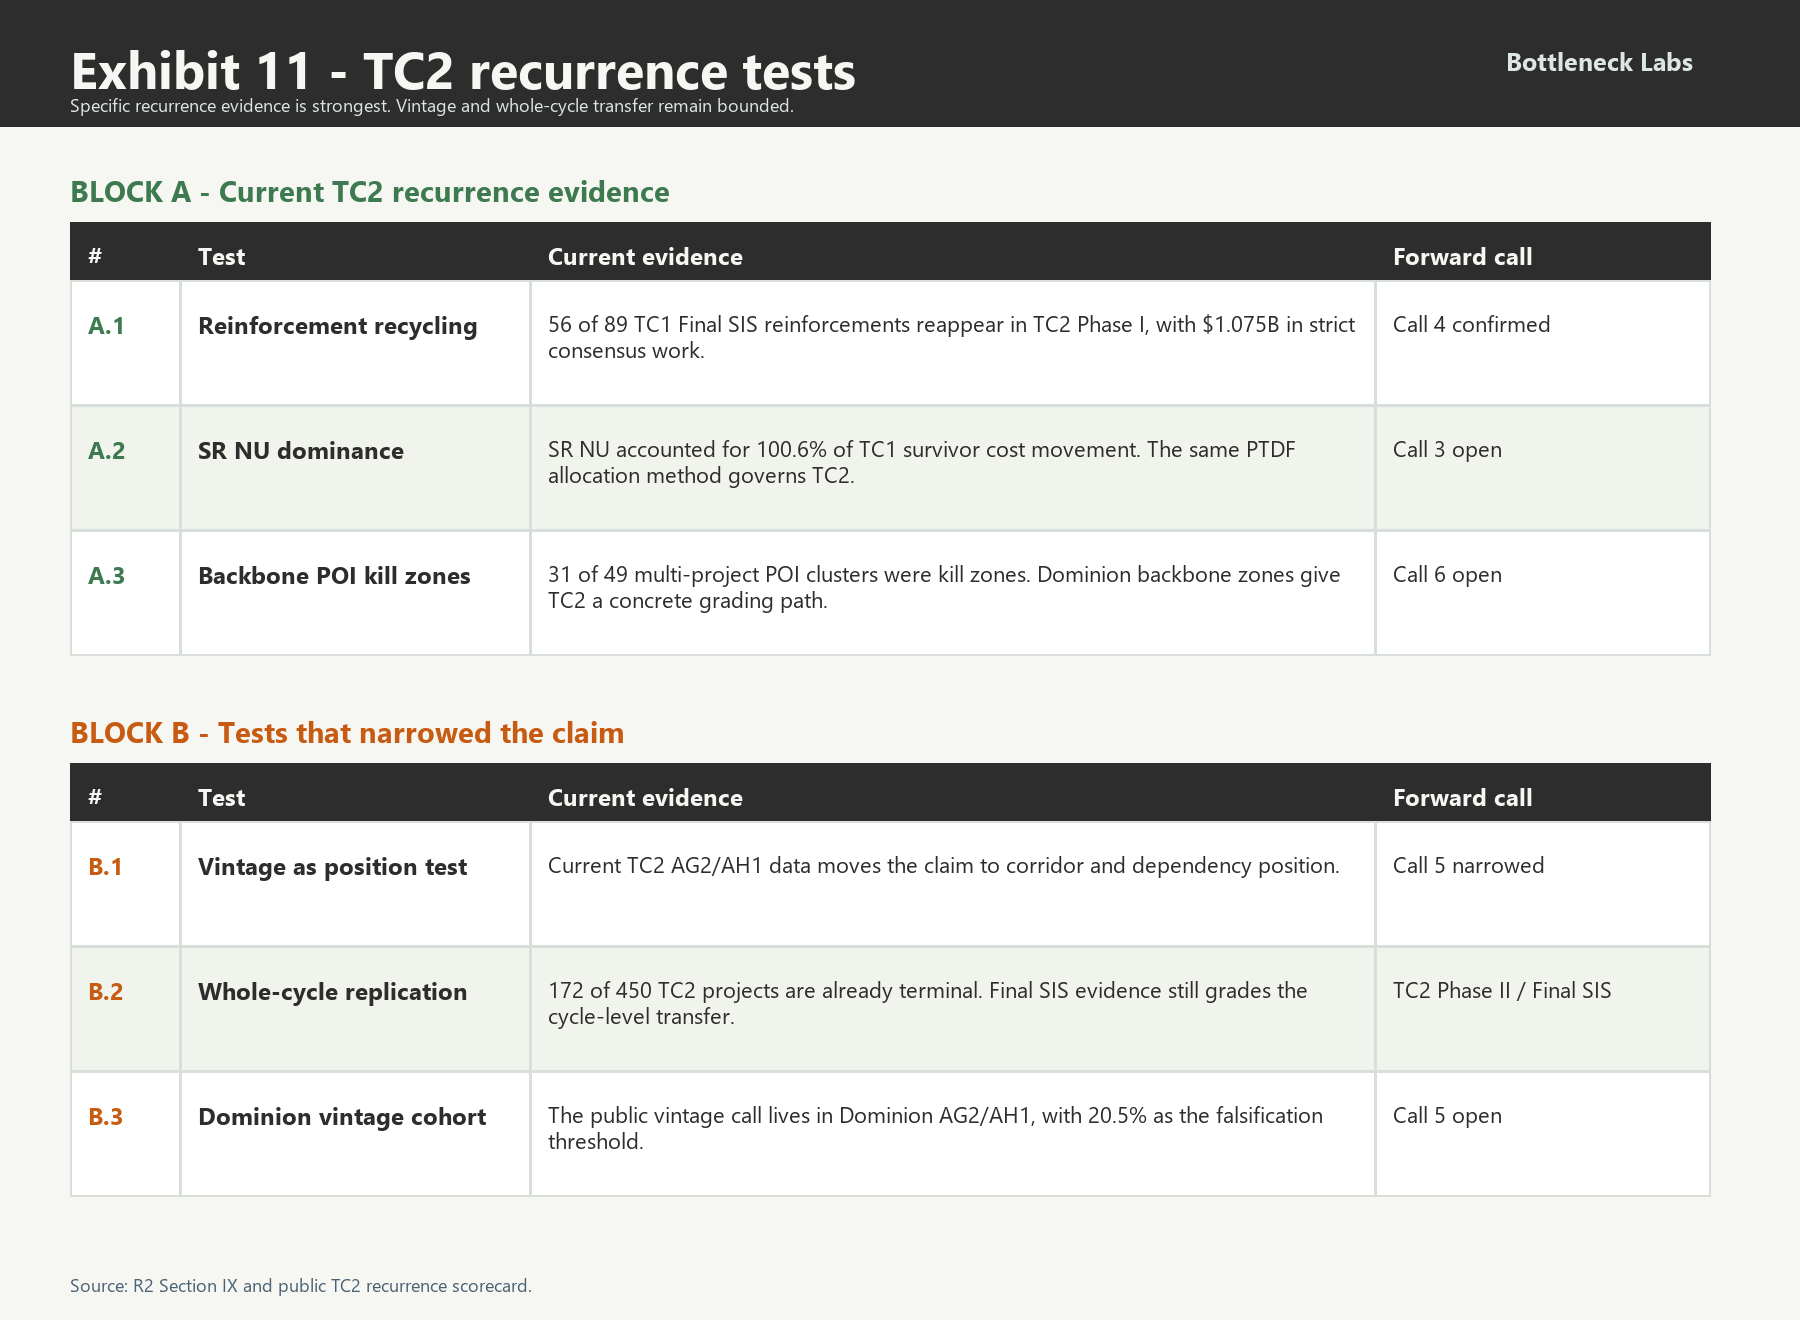
Bottleneck split TC1 into transfer classes before reading TC2. Physical recurrence and allocation mechanics were first. POI/backbone exposure, vintage timing, and whole-cycle replication completed the set. TC2 Phase I has already graded those classes unevenly. Reinforcement recurrence is the strongest current transfer signal. SR NU and backbone-zone exposure remain live tests. Queue vintage alone weakened as soon as AG2 and AH1 stopped moving in a clean line.
For TC2, start with corridor and POI before checking the queue label. The constraint attaches to the physical entry point before it attaches to the cohort label. Next-cohort projects in the same constrained corridors and shared-dependency chains should face the exposure that made AG1 fragile in TC1. Queue label becomes useful after the place-based exposure is visible.
Of the 89 reinforcements in TC1's Final SIS, 56 reappear in TC2's Phase I docket. The dollar figure is $1.075B in the strict consensus bucket. This is a TC2 Phase I recurrence signal ahead of final TC2 burden. Where a reinforcement addresses a structural thermal constraint, withdrawal of one cohort may remove or reprice that cohort's allocation as the underlying constraint remains in place. A later cluster can re-identify and reallocate the same physical work if the loading conditions recur.
The recycled set is tractable. Every line item has an RTEP ID and a transmission owner. It also has a cost estimate and a project allocation list. The TC2 developers allocated to these line items can be enumerated.
Evidence. Workbook tabs TC1 Universe and Reinforcement Matching. Methodology claim trail rows cover the 56 confirmed consensus matches, 23 single-method flags, and 10 absent reinforcements.
Forward call. TC1-to-TC2 reinforcement recycling exceeds 50%. Current TC2 Phase I recurrence is 56 of 89, or 62.9%, so this call is already confirmed at the recurrence stage.
System Reliability Network Upgrades accounted for 100.6% of all cost movement across TC1 survivors. The other three channels net slightly positive. Those channels are TOIF, Physical NU, and Affected System. SR NU dominance is structural to PJM's PTDF allocation methodology, which has stayed consistent between TC1 and TC2. Dominion's SR NU held because Dominion's corridors are deeply enough constrained that withdrawal volume failed to push loading below thermal triggers. ComEd compressed because the threshold process fired on cheap, volume-sensitive reinforcements.
AEP aggregate SR NU compressed by 95.8% because so many neighbors left that aggregate loading dropped below most thermal triggers. Survivors inherited a small bill. The killing happened first, before that relief reached the non-survivors.
The territorial split between compression in ComEd and AEP-Indiana and persistence in Dominion is determined by corridor congestion depth relative to withdrawal volume. The physical topology of PJM's transmission system has stayed in place. TC2 gives the same topology another study cohort.
Evidence. Workbook tab Cost Trajectories. Data appendix Section III walks the channel decomposition number by number.
Forward call. SR NU compression exceeds 90% in TC2 aggregate by Final SIS. The call fails below 85%.
The substation lottery (Section VI) shows 31 of 49 multi-project POI clusters as kill zones and 11 as safe harbors. The driver is reinforcement-cost concentration. When a substation sits at the end of a thermally constrained path, its reinforcement requirement is backbone-grade, and that backbone cost is divided among the projects clustered at that POI. If the cluster is small, say four projects, the per-project allocation can become difficult to finance at ordinary project hurdle rates.
Lone Pine 115 kV had 5 projects and 0 survivors. Sullivan-Rockport 765 kV had 3 projects and 0 survivors. The Yadkin-Fentress 500 kV cluster had 13 projects allocated on RTEP n8492 at $80M Final SIS. Each case ties a small project cluster to a large shared reinforcement. Each case gives TC2 a concrete zone to watch.
We expect this pattern to recur in TC2 when the same physical reinforcement family and transmission owner recur. The same expectation applies when voltage class and corridor exposure recur. The confidence is highest for exact RTEP and facility matches in the 56 confirmed-recycled set. It is lower for family-level analogs in the 23 single-method-match set. Backbone reinforcements concentrate cost on whichever projects share their thermal trigger. Dominion's TC2 backbone clusters are identifiable in advance.
Three candidates provide a physical corridor, a traceable identifier, and a future TC2 grading path. They are Yadkin-Fentress 500 kV line #588 (RTEP n8492), North Anna-Midlothian line 576 (RTEP n9191), and the already-recycled Midlothian-Carson line 563 (RTEP n9139). The call is stronger at that specific-zone level.
Evidence. Workbook tab POI Clusters. Methodology claim trail rows cover Dominion clustered POIs and Final SIS reinforcement families.
Forward call. At least one of the three Dominion backbone reinforcement zones, Yadkin-Fentress line #588, North Anna-Midlothian line 576, or Midlothian-Carson line 563, has zero clustered TC2 projects reach Final SIS. The call fails if all three zones produce at least one TC2 Final SIS project at the cluster level.
TC1 showed a smooth survival profile across AE1 through AF2, roughly 35% to 40%, followed by the AG1 cliff at 17.4%. A queue prefix mixes time in development, position in the cohort, and location on constrained topology. TC1 could support a strong AG1 finding because AG1 sat at the end of the crowded cohort and the within-territory Dominion test preserved the signal.
TC2 mid-cycle data breaks the smooth queue-label line between AG2 and AH1. The TC1 AG1 result remains useful because it was strongest where vintage and position were jointly visible. The transferable test changes. The live question is whether next-cohort projects in Dominion and similar constrained corridors repeat the TC1 positional penalty.
Evidence. Live TC2 vintage-transfer test using the AG2/AH1 Phase I universe. The current package preserves the non-monotonicity finding as a boundary condition for Call 5.
The full TC1 signature needs Final SIS evidence before it can be transferred as a cycle-level claim. At the current mid-cycle snapshot, 172 of 450 TC2 projects are in confirmed terminal status. That is a 38.2% exit rate on a larger and more recent universe, compared with TC1's 34.3% pre-Phase II exit rate. The signal is early and real, covering one channel of one phase. Territory pattern, vintage signature, and SR NU compression magnitude still need TC2 Phase II and Final SIS documents. The recurrence calls in Block A stay specific because each rests on its own evidence.
Evidence. TC2 Phase I withdrawal data show 172 of 450 in confirmed terminal status as of 2026-03. The live TC2 territory-regime test has directional, below-proof support. The current values are r=0.5525, p=0.1556, and n=8.
The TC1 evidence supports a positional explanation for the AG1 cliff. That explanation transfers cleanly only to cohorts with the same corridor congestion and shared-dependency exposure. The scoreable claim is narrower than a whole-cycle vintage penalty. Dominion AG2/AH1 survival stays below 15%, with 20.5% as the falsification threshold. The public scorecard keeps the prediction at that territory-specific level.
One candidate prediction was too easy to satisfy. A single withdrawal from a 54-project recycled-zone set could pass by noise. The public call now asks for a spread. A token event has too little signal. Confirmed recycled-linked TC2 projects must exit at least 10 percentage points above the non-linked baseline after Phase II cost detail publishes. Anything smaller is treated as ordinary TC2 attrition until the evidence says otherwise.
TC2 entered Phase I with 450 projects and 860 reinforcements. As of March 2026, 172 of those projects are in confirmed terminal status, meaning withdrawn, retracted, canceled, or annulled. 278 remain live. Decision Point 1, the first formal off-ramp where developers can withdraw without forfeiting readiness deposits, has already operated. TC2 Phase II reports are anticipated in June 2026. The Block A tests are the ones to read first in those reports. The narrowed tests in Block B remain live because TC2 has already changed the vintage and whole-cycle framing.
We classified each TC2 project by the gap between its required infrastructure timeline and its contractual deadlines. One hundred seventeen projects fall into the 60+ month infrastructure-mismatch band, where reported construction timelines appear difficult to reconcile with standard financing and COD windows. Another 137 face delays that stretch timelines and still appear financeable in ordinary cases. Thirty-one sit under active cost pressure from shared reinforcement reallocation.
The remaining 165 face lighter infrastructure requirements and shorter construction windows. The 117 projects in the 60+ month mismatch band define the sharper prediction. We expect fewer than 10 of them to reach Final SIS.
Scoreable calls (scored as later PJM documents arrive).
| Call | Prediction | Falsification Threshold | Eval Date |
|---|---|---|---|
| Call 1 | TC2 Final SIS survivors land in the 64 to 83 range | Fewer than 60 or more than 90 survivors | 2027-Q4 |
| Call 2 | The 60+ month infrastructure-mismatch cohort produces fewer than 10 Final SIS survivors | 10 or more reach Final SIS | TC2 Final SIS |
| Call 3 | SR NU compression exceeds 90% in TC2 aggregate | Compression below 85% | TC2 Final SIS |
| Call 4 | TC1-to-TC2 reinforcement recycling exceeds 50% | Recycling below 50% | Confirmed at 62.9% |
| Call 5 | Dominion AG2/AH1 cohort survival in TC2 stays below 15% | Survival reaches or exceeds the 20.5% Dominion older-vintage TC1 baseline | 2027-Q3 |
| Call 6 | At least one of three Dominion backbone zones has zero clustered TC2 projects reach Final SIS | All three zones produce at least one TC2 Final SIS project at cluster level | 2027-Q4 |
| Call 7 | Confirmed recycled-linked TC2 projects exit at least 10 percentage points above non-linked TC2 projects after Phase II cost detail publishes | Linked-minus-non-linked terminal-exit spread is below 10 percentage points at the Phase II grading snapshot | 2026-Q4 to 2027-Q2 |
Each outcome is specific, testable, and dated. The live TC2 scorecard updates as data lands. The point is to make the next PJM document decisive before it arrives.
Put a Phase I cost letter in front of an account team. First isolate SR NU share. The first question is which reinforcement family moves the case. From there, ask which POI cluster owns the neighbor problem and which PJM artifact can change the answer. Then check live neighbors, the territory timing pattern, and the vintage cohort.
Each account gets a different read. An infra fund or power investor gets an asset-selection filter. A platform owner or developer gets a keep, kill, reprice, sell, or monitor sequence. A project-finance team gets the fields that can change security, debt timing, or COD assumptions. A hyperscaler or load buyer gets a procurement warning when the project or corridor evidence connects cleanly to deliverability and timing.
For a fund evaluating interconnection-stage assets in PJM, the Phase I cost letter is the opening number. A Dominion project with a low headline Phase I cost can still sit on a backbone corridor that becomes expensive as shared-network exposure hardens. A ComEd project with a high early SR NU allocation can become financeable if neighbor withdrawal clears threshold-sensitive reinforcements. The diligence work is to identify which path the project is on before the next decision point.
For a planner running PJM's next proactive buildout study, the 56 reinforcements that recycled from TC1 Final SIS into TC2 Phase I mark repeated stress on the same physical grid. Each repeated infrastructure family is a place where interconnection study and transmission planning keep touching. The planning question is whether that family should keep moving through cluster studies or be pulled into a proactive buildout frame.
For a hyperscaler or large-load buyer, TC1 gives a procurement distinction between queue-visible supply and power-ready supply. A buyer can support a project, negotiate attributes, or evaluate behind-the-meter alternatives. The remaining question is whether the interconnection path survives the shared-upgrade, POI, and clock exposure TC1 made visible.
Data provenance. All TC1 data was reconstructed from PJM-posted study results. The source set begins with Phase I executive summaries. Phase II inputs come from project-level cost-allocation records visible through PJM-posted study materials. Later stages use Phase III project reports and the Final SIS workbook. The canonical dataset was frozen on 2026-03-13. The companion workbook and data appendix map each number to a source table, workbook tab, and calculation step.
Statistical approach. Cross-tabulation with Fisher's exact tests (FDR-corrected) was the primary analytical method. Territory and vintage effects were tested individually and in interaction. A logistic regression with 11 features (territory indicators, vintage, log(MW), resource type, log(Phase I cost), log(reinforcement count)) served as internal validation. The full model significantly outperforms a territory-only model (likelihood ratio test chi-squared = 29.23, df = 7, p = 0.000131). AG1 vintage is the strongest single predictor (coefficient = -1.129, OR = 0.323, p < 0.0001).
The evidence tables also include a deterministic stratified five-fold diagnostic package. Cost-only AUC is 0.451 with Brier 0.200, territory-only AUC is 0.618 with Brier 0.191, and full diagnostic AUC is 0.693 with Brier 0.181. The full model's top-decile survival rate is 41.9%, 1.55x the base rate. Leave-one-out cross-validation accuracy was 74.2% for the full model vs. 72.9% for the territory-only model. Accuracy is deliberately secondary because a model that predicts most projects die can look accurate in a 27.1% survival dataset. Use the model for ranking and diligence triage. TC2 will provide the out-of-sample grade.
Reinforcement matching. TC1-to-TC2 reinforcement recycling was established by consensus of three independent matching methods. RTEP ID exact match (48 of 89), title fuzzy match at Jaccard >= 0.5 (50 of 89), and facility/segment plus transmission owner match (69 of 89). The canonical rate of 56/89 (62.9%) requires agreement of two or more methods. The upper bound using any single method is 79/89 (88.8%). The lower bound using all-three-agree is 48/89 (53.9%).
AEP territory split. The source table reports AEP as a single transmission owner across four state-level companies. The Section II prose and the territory exhibits use a state-level split. AEP-Indiana has n=28 and 32.1% survival. AEP-Virginia, or Appalachian, has n=7 and 14.3% survival. AEP-Ohio has n=4. AEP-Michigan has n=5. AEP-WV has n=2. The AEP-Indiana subset has the meaningful signal. Ohio, Michigan, and WV are reported descriptively.
Sample size caveats. Territory-level findings for MAIT and EKPC should be treated as directional. MAIT has n = 7 survivors. EKPC has n = 5. AEP-Ohio has n=4 and AEP-WV has n=2. Smaller transmission owners should also be treated as directional. Findings for ComEd and Dominion are more robust. ComEd has n = 27 survivors. Dominion has n = 25. AEP-Indiana has n = 9 survivors out of 28. AEP aggregate has n = 17. These stronger findings still reflect a single cycle. TC2 provides the out-of-sample test.
Evidence tables. The evidence file includes the reconciled TC1 tables and diligence screen. It also includes model diagnostics, evidence register, and scorecard. The data appendix walks the numbers to source tables and calculation steps. The claim route is checkable from the package materials.
Reproducibility. Each main number has a source route, denominator, and calculation note. The public package preserves enough detail to rerun the headline counts and cost-channel decomposition. It also preserves the model diagnostic and reinforcement match. The same support labels appear across the prose, appendix, and evidence file.