The Grid Test Behind The AI Power Story
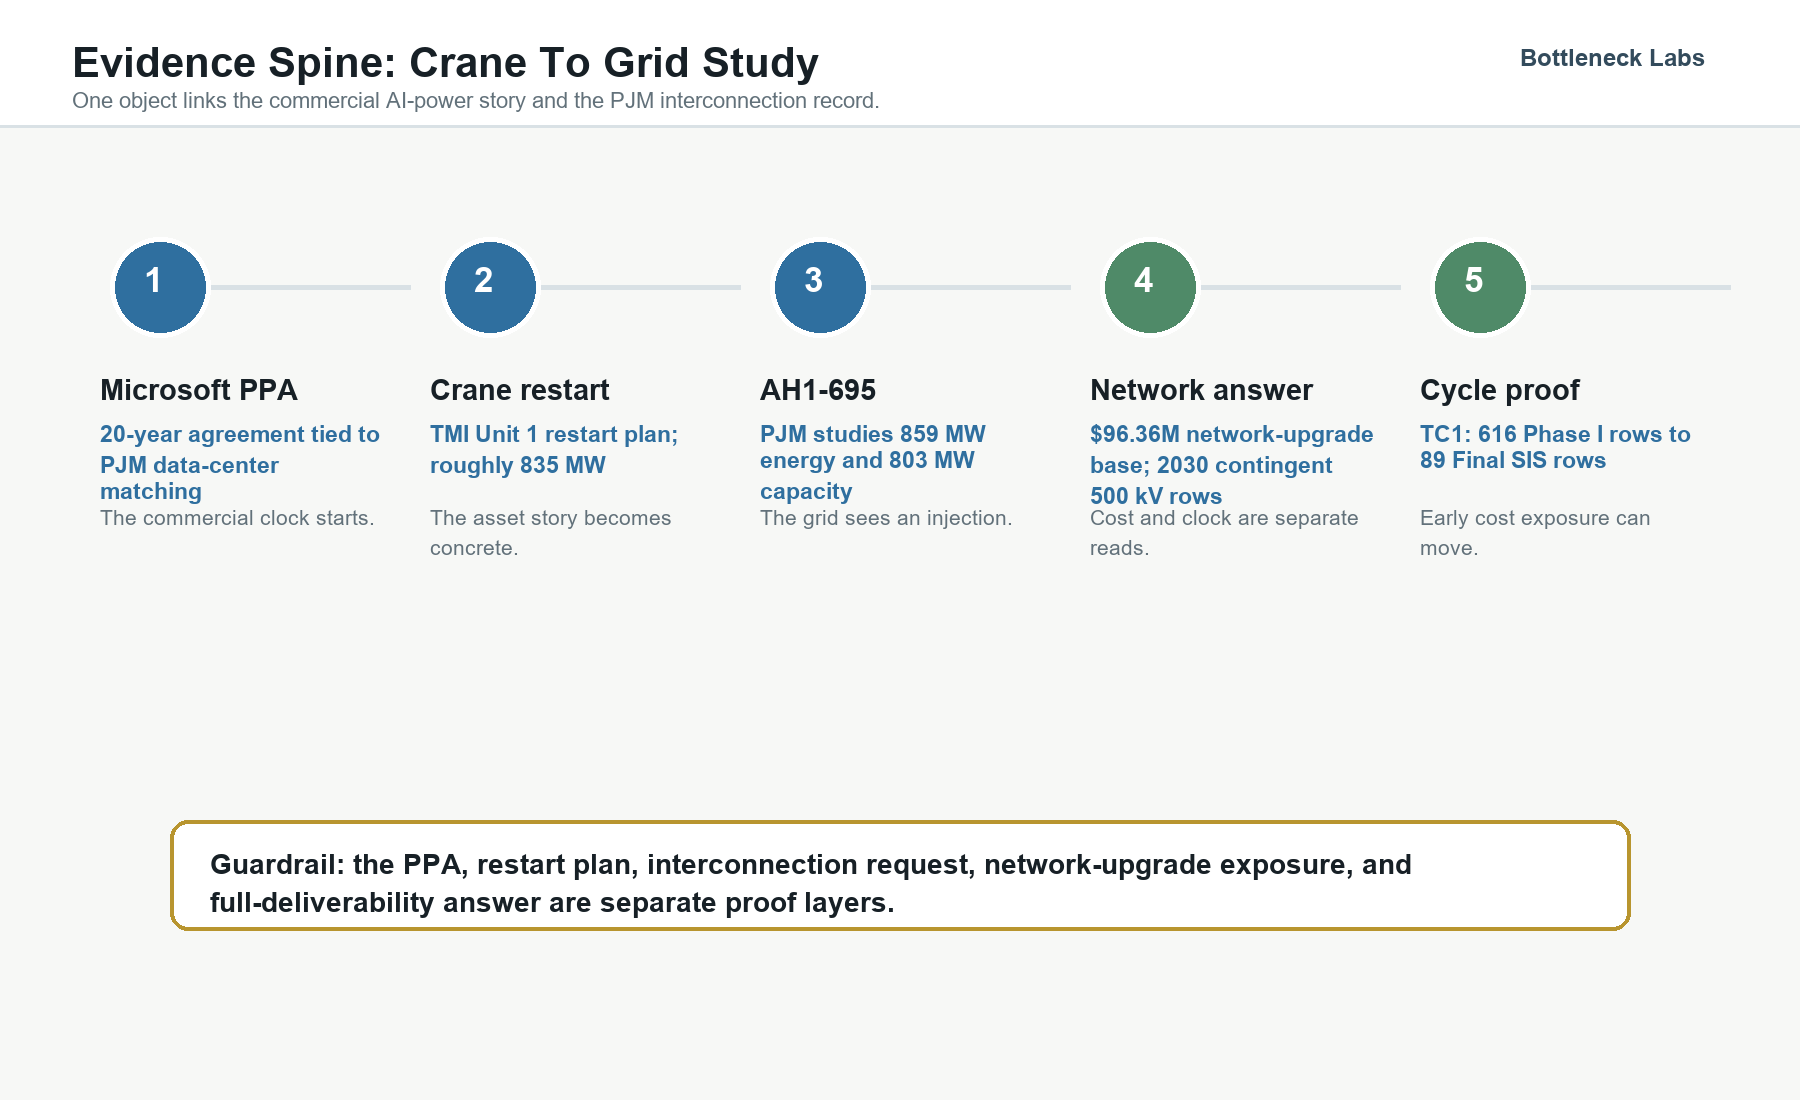
Microsoft and Constellation found a power answer that looks almost designed for the AI infrastructure moment. In September 2024, Constellation announced a 20-year power purchase agreement with Microsoft to support the restart of Three Mile Island Unit 1 as Crane Clean Energy Center. The plant was expected to add roughly 835 MW of carbon-free energy to PJM, and Microsoft said the agreement would help match the power its PJM data centers use with carbon-free energy.
Start with the public announcement, where Microsoft gets a long-term carbon-free power agreement and Constellation gets a restart path at Crane. Jobs, capacity, and AI load all sit in the same story. Then open PJM's Phase I report for AH1-695, a Constellation nuclear request at Three Mile Island 230 kV, evaluating an 859 MW injection with 803 MW of capacity. The press release becomes a transmission-network test. The carbon-free-energy claim and the Pennsylvania jobs story land beside the same engineering question. What does that injection do to the grid?
For the buyer, the unsettled part is physical. A contract can commit to the power. PJM still has to test whether 859 MW at Three Mile Island 230 kV can enter the grid without violating reliability criteria. If that answer depends on network work outside the buyer's delivery window, the power strategy inherits a grid clock.
The conversion happens fast. The buyer commitment and the restart plan leave the grid condition unresolved. PJM reduces the project to a physical injection at a bus. The model studies flows and identifies reliability violations. It assigns network-upgrade exposure before the final deliverability answer exists, and those assignments set readiness-deposit stakes.
PJM Is Already Pricing The Pressure
The Crane agreement arrived in an already tight power market. PJM Interconnection operates the bulk power grid across 13 states and the District of Columbia, serving more than 67 million people. Its latest capacity auction shows data-center demand moving out of the background and into reliability math.
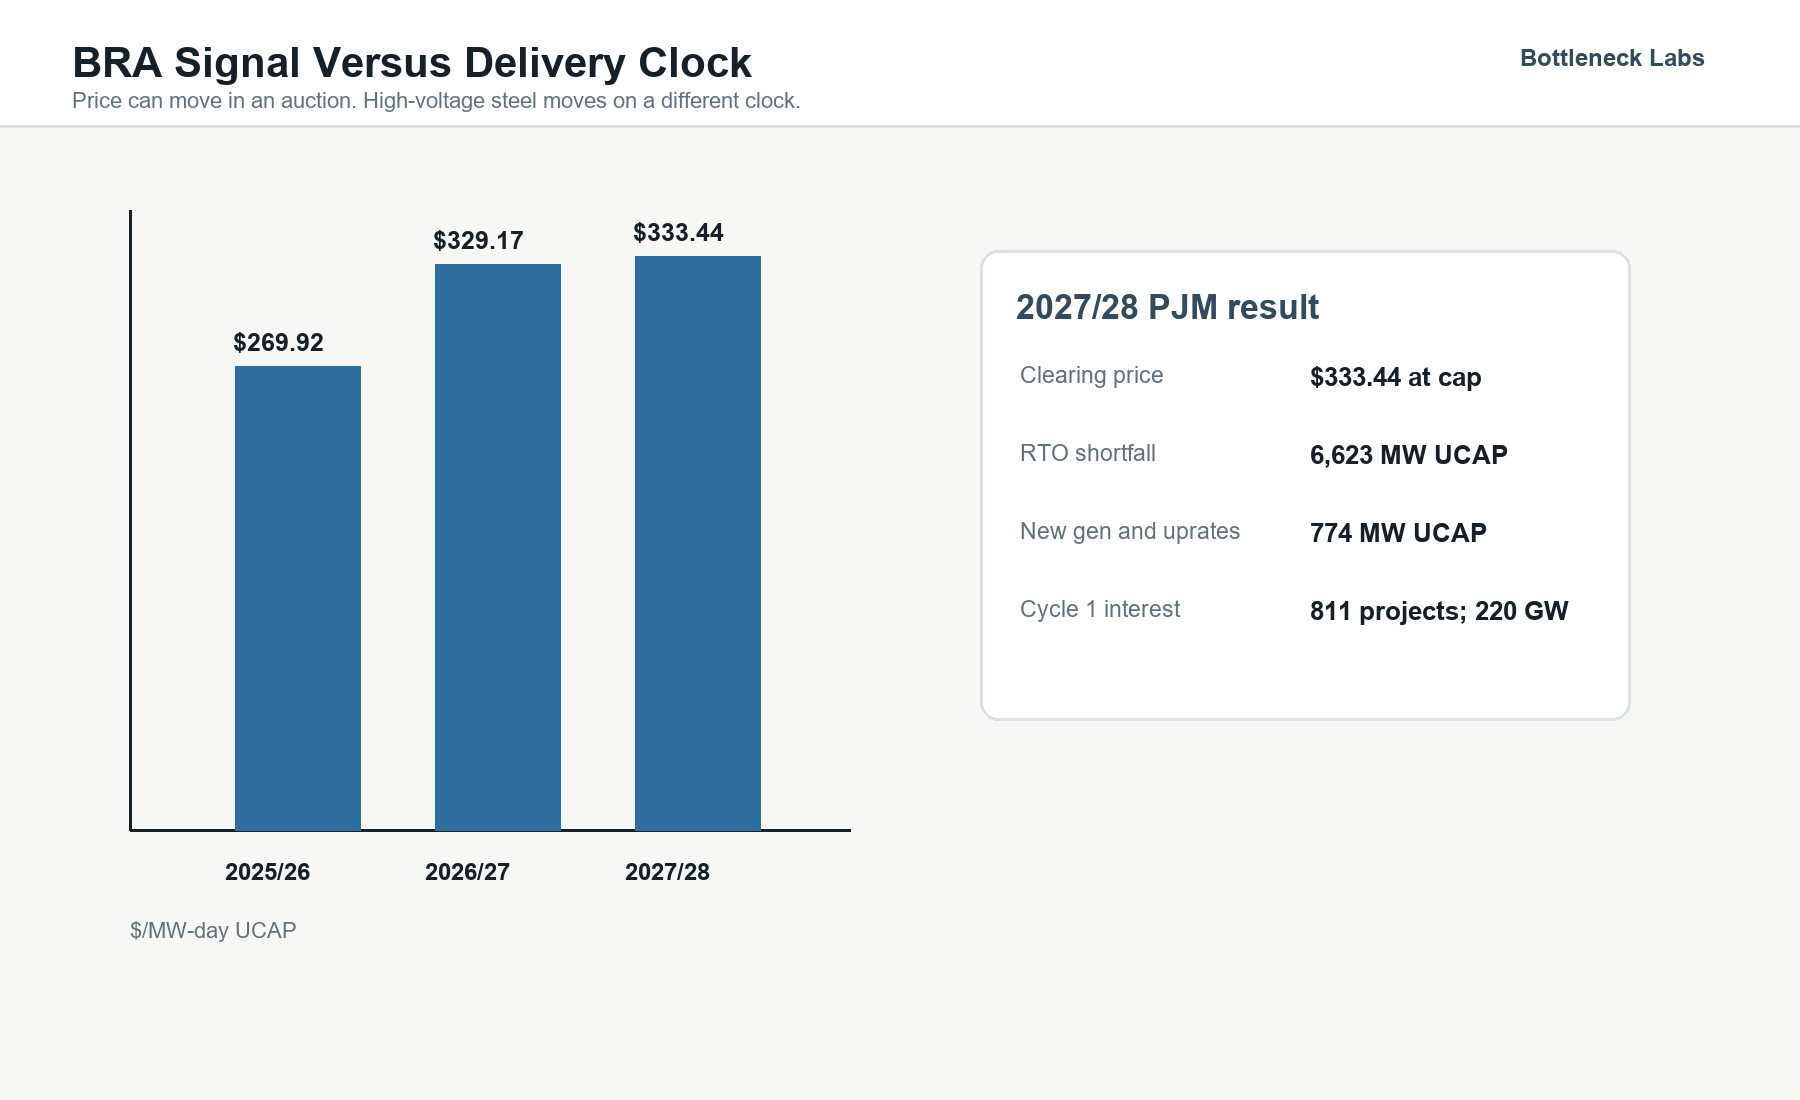
PJM's 2027/2028 Base Residual Auction, the forward auction that procures capacity for a future delivery year, cleared at the Federal Energy Regulatory Commission (FERC)-approved cap of $333.44 per MW-day of unforced capacity. Unforced capacity, or UCAP, is PJM's reliability-adjusted measure of how much capacity a resource can be counted on to provide when the system is under stress. A data-center buyer needs that accredited supply number because raw nameplate leaves unresolved how much capacity PJM will count in a stressed system.
The same announcement reported 134,479 MW of UCAP from generation and demand response in the auction. Areas using Fixed Resource Requirement commitments, a structure where certain zones meet their capacity obligations outside the central auction, added another 11,299 MW. The combined 145,777 MW was still 6,623 MW short of PJM's reliability requirement. PJM then identified the driver for the capacity squeeze. Nearly 5,100 MW of a 5,250 MW increase in the forecast peak load came from data-center demand.
High capacity prices can pull developers into the queue. Deliverability still has to come from the interconnection record itself. In April 2026, PJM said 811 new generation projects representing 220 GW of nameplate capability had applied to connect under its reformed interconnection process. PJM also said demand growth is outpacing new supply and that timely interconnection is critical.
The auction price says supply is scarce. The interconnection queue decides which proposed megawatts can become usable capacity at the place and date a buyer needs. Capacity-clearing totals and buyer-deliverable capacity are different objects.
How Demand Becomes A Grid Claim
A project enters interconnection with a proposed resource and a point of interconnection. The file also brings a technical model and site control. Deposits and a development plan come with it. The finished deliverable megawatt comes later, after the study answer. PJM's deposit schedule reflects that uncertainty. Generation requests face a $4,000 per MW readiness deposit and study deposits that can reach hundreds of thousands of dollars before the network-upgrade answer is known.
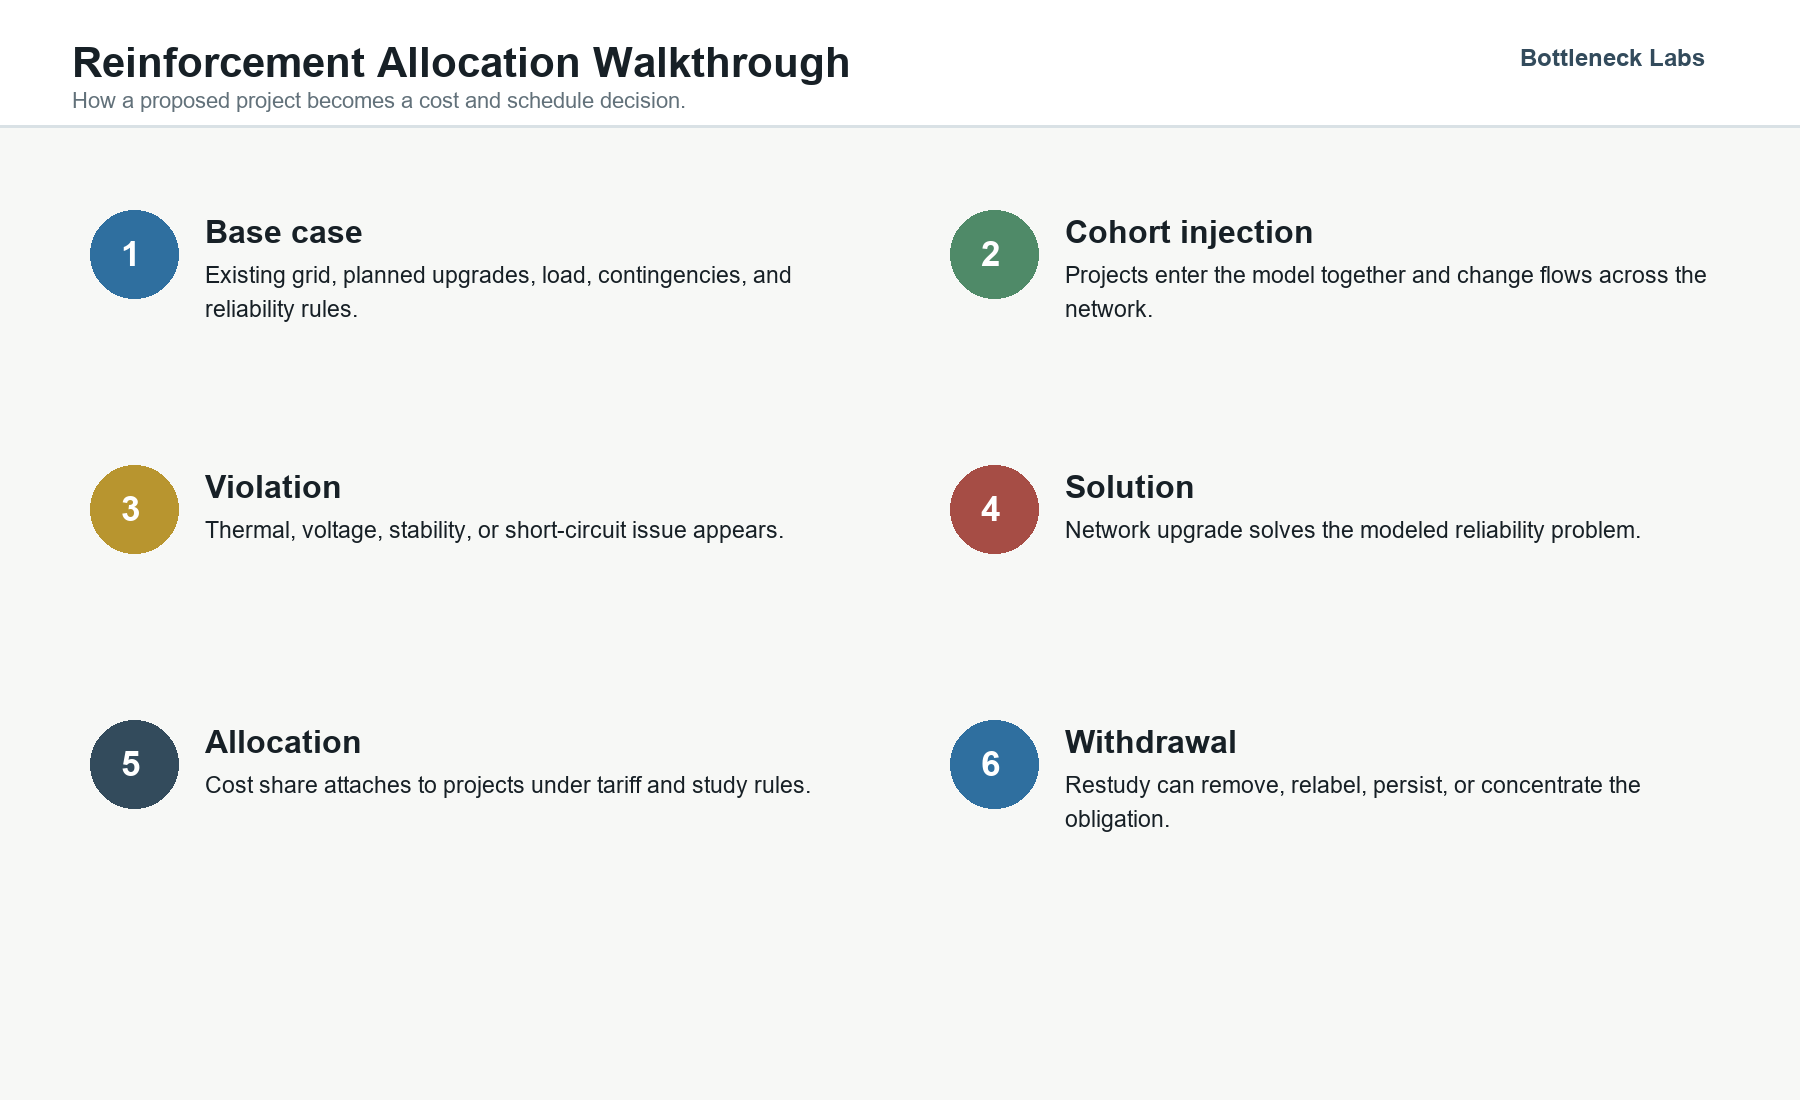
The first physical question is simple to state. If this generator injects at this bus, can the transmission system still satisfy reliability rules? PJM asks that question with surrounding projects and load forecasts in the model. Planned upgrades and operating limits sit in the same model. A strong buyer, a strong site, and a strong capacity price leave that question intact.
Power flow follows the grid. A new injection at one bus changes flows across lines and transformers that can sit far from the fence line of the project. A site can look easy on land and voltage, then hit a transmission path with little remaining headroom under stressed conditions.
That is how network upgrades enter the project memo. PJM identifies work on the transmission system needed for reliable interconnection or deliverability. It can be relay work, substation equipment, transformer additions, line rebuilds, voltage support, or a new high-voltage path. The upgrade is the system's answer to the injection.
The hard part is that the answer belongs to the cohort as well as the project. When several queued resources contribute to the same modeled overload, the cost can be shared. If enough neighbors withdraw, the overload can clear and the upgrade can disappear. If the constraint remains, the surviving projects can receive a different share of the same physical work. That is the capital-destruction mechanism inside the queue. The developer is paying to keep a project alive as the shared cohort and the next study artifact can still rewrite the exposure.
Follow the allocation backward. A proposed resource contributes to a modeled reliability violation. The tariff and study process assign some cost responsibility for the upgrade that solves the violation. The allocation is financial. The root is physical. The capital file moves because the physics and the neighbor set move first.
AH1-695 Shows The Clock
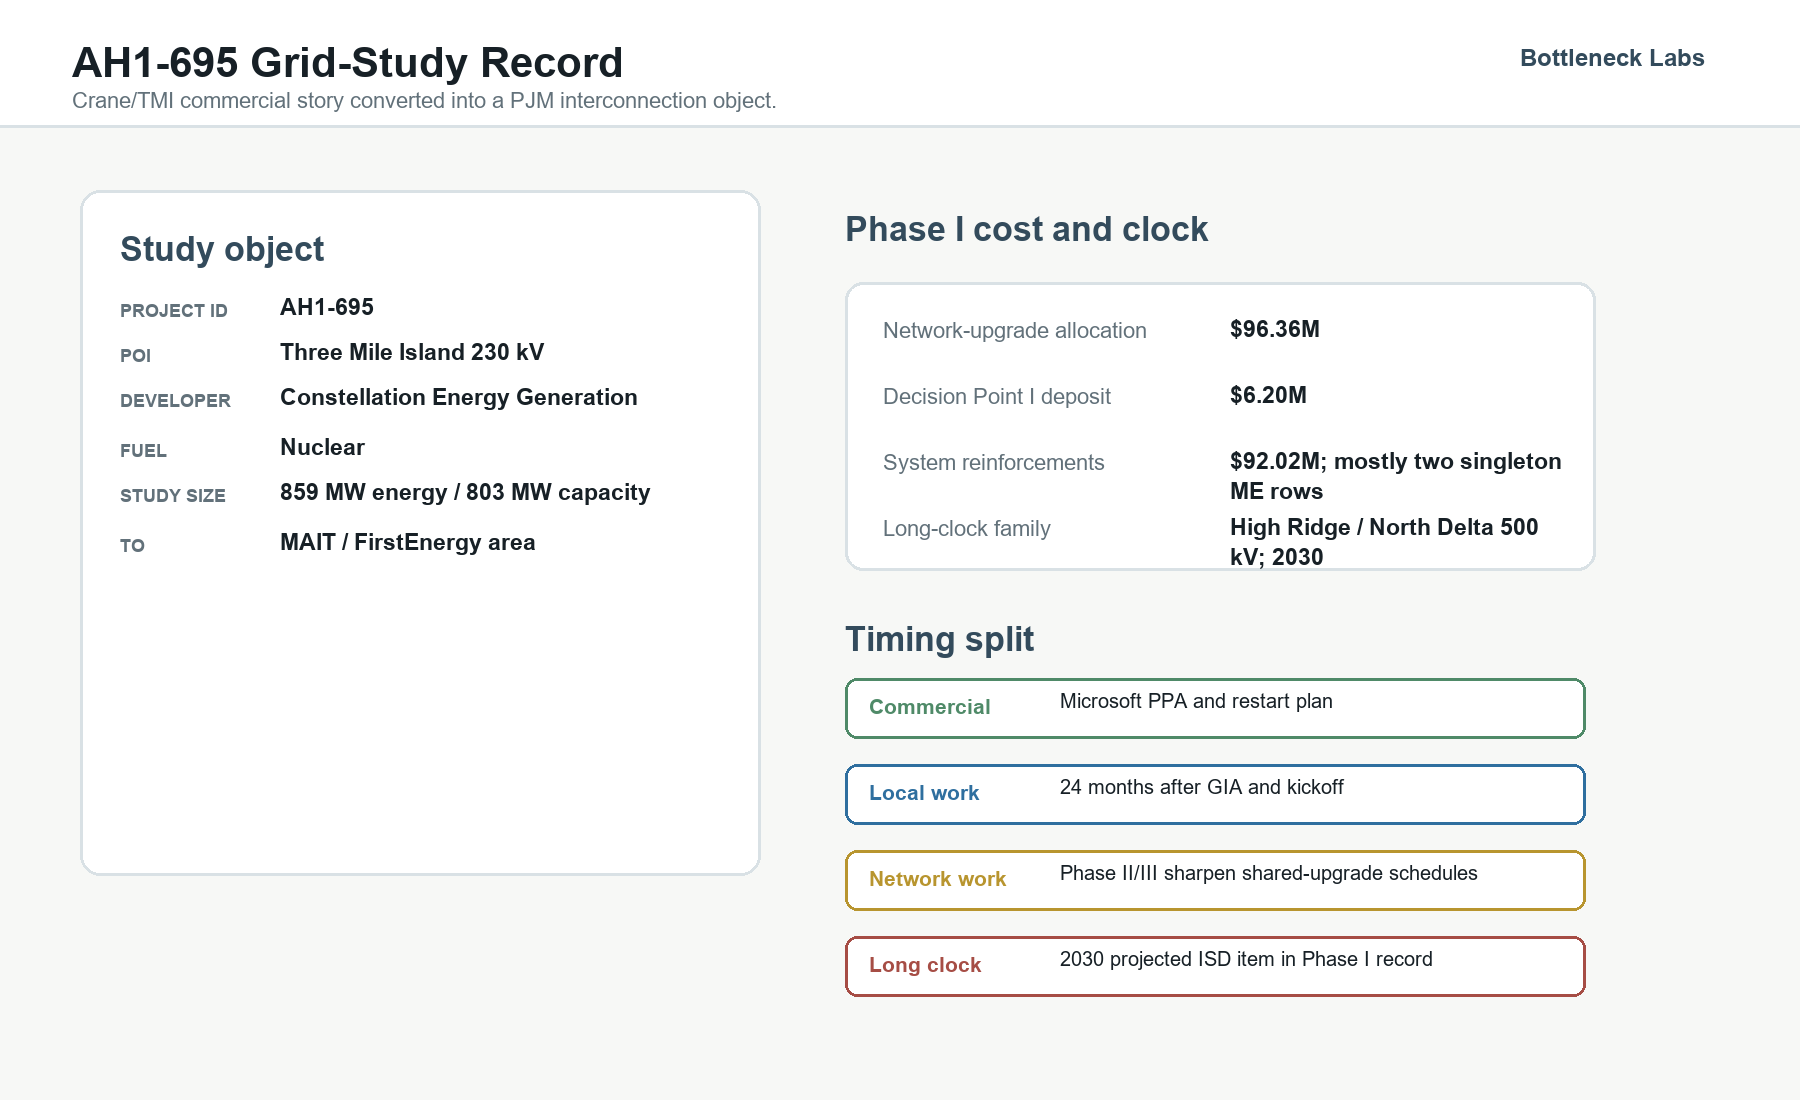
PJM's AH1-695 Phase I report makes the abstract process concrete. The project is listed as a Constellation Energy Generation nuclear request in Dauphin County, Pennsylvania, at the Three Mile Island 230 kV point of interconnection. PJM evaluated it as an 859 MW energy injection and 803 MW of capacity.
The public record puts the larger schedule question beyond the direct physical connection. PJM's report says the physical connection work is expected to take 24 months after a Generator Interconnection Agreement and construction kickoff. Then the report separates that local work from the broader network answer. Schedules for any required network-impact reinforcements will be more clearly identified in Phase II and Phase III.
The Phase I cost surface turns that split into dollars. PJM calculates AH1-695's second readiness deposit from Phase I network-upgrade cost allocation. The report lists $9.64 million as 10% of allocated Phase I network-upgrade cost, subtracts the $3.44 million first readiness deposit, and produces a $6.20 million second readiness deposit due at Decision Point I. Failure to provide that deposit can terminate the request.
The cost record is more specific than a headline total. The extracted AH1-695 cost row assigns $97.21 million of Phase I cost exposure. Of that, $96.36 million is network-upgrade exposure used in the readiness-deposit calculation. That base includes $4.35 million of physical interconnection network upgrades and $92.02 million of system reinforcements. The connection-side remainder is $790,461 of transmission owner interconnection facilities and $57,200 of additional charges.
The 71 reinforcement rows split into costed and contingent records. Two costed system-reinforcement rows are singleton allocations to AH1-695. One assigns $62.05 million to rebuild 12.09 miles of the TMI to AE2-211 Tap 230 kV line. The other assigns $29.83 million to rebuild 5.95 miles of AE2-211 Tap to Jackson 230 kV. One shared APS wave-trap row allocates $137,130 to AH1-695 out of a $364,562 total row. The other shared rows are currently zero-dollar contingent or potential deliverability rows. That is where the High Ridge / North Delta 500 kV family enters the read. It is the long-clock deliverability dependency PJM says may be needed if AH1-695 wants to come online before the upgrade is complete.
| AH1-695 object | What the record shows | Underwriting use |
|---|---|---|
| Commercial object | 20-year Microsoft / Constellation power agreement tied to the Crane restart | Explains why the megawatts matter to AI power procurement. |
| Local interconnection clock | 24 months after a Generator Interconnection Agreement and construction kickoff | Shows the restart's direct physical-connection schedule. |
| Network-upgrade exposure | $96.36 million used in the readiness-deposit base: $4.35 million physical NU plus $92.02 million system reinforcements | Shows why the deposit and financing file are driven by network upgrades, not the PPA headline. |
| Costed system-reinforcement split | $91.88 million in two singleton ME 230 kV rebuild rows; $137,130 currently allocated on one shared APS row | Shows that the large current dollar exposure is not the same thing as the long-clock High Ridge family. |
| Long-clock contingent family | High Ridge / North Delta 500 kV rows with 2030 projected dates and interim-deliverability language | Shows why full deliverability can sit on a different clock than the public commercial story even when current allocated cost is zero. |
Read the table as two separate clocks. The local interconnection path can fit the commercial story. Full deliverability can still depend on late-decade network work. The table has one narrow job. It keeps current dollar exposure and long-clock dependency in separate records.
What Is Settled And What Is Still Open
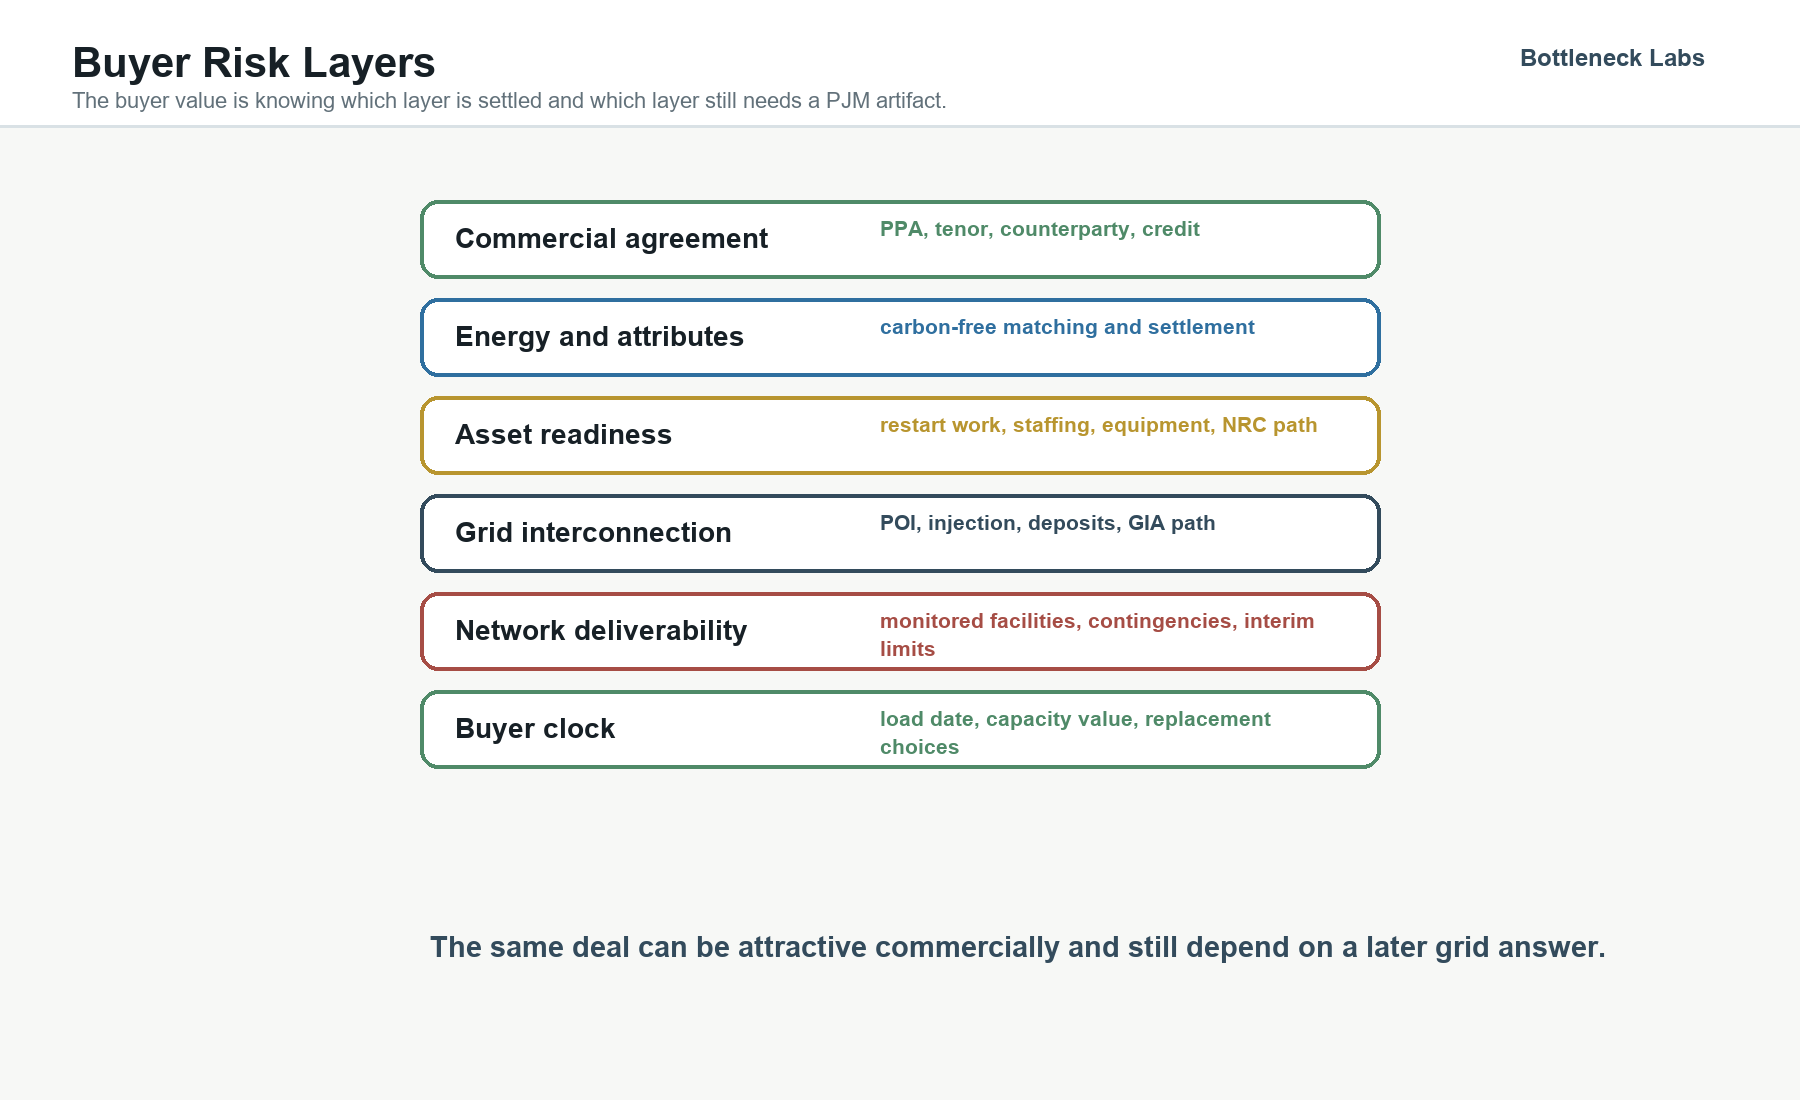
Put the PPA beside AH1-695. One document supports the restart and Microsoft's PJM carbon-free matching claim. The other evaluates AH1-695 as an 859 MW injection at Three Mile Island 230 kV.
The open question is whether the grid can deliver the physical output on the buyer's clock and at the exposure level the restart can absorb. The interconnection record can still change the purchase value, the full-output date, and the capital required to keep the request alive. That gap is the part of the agreement a study report can still reprice.
That is why the diligence question is sharper than "does the project have a buyer?" A power agreement can help move a queue request into deposits and network studies. Later PJM artifacts still control the full-deliverability answer. The buyer has to underwrite the gap between commercial commitment and completed grid answer.
What TC1 Adds
AH1-695 is a live study object. Its later Phase II and Phase III records can revise the costs, solutions, and schedules. A live record is useful for watching the mechanism. Completed-cycle proof comes from a finished study record.
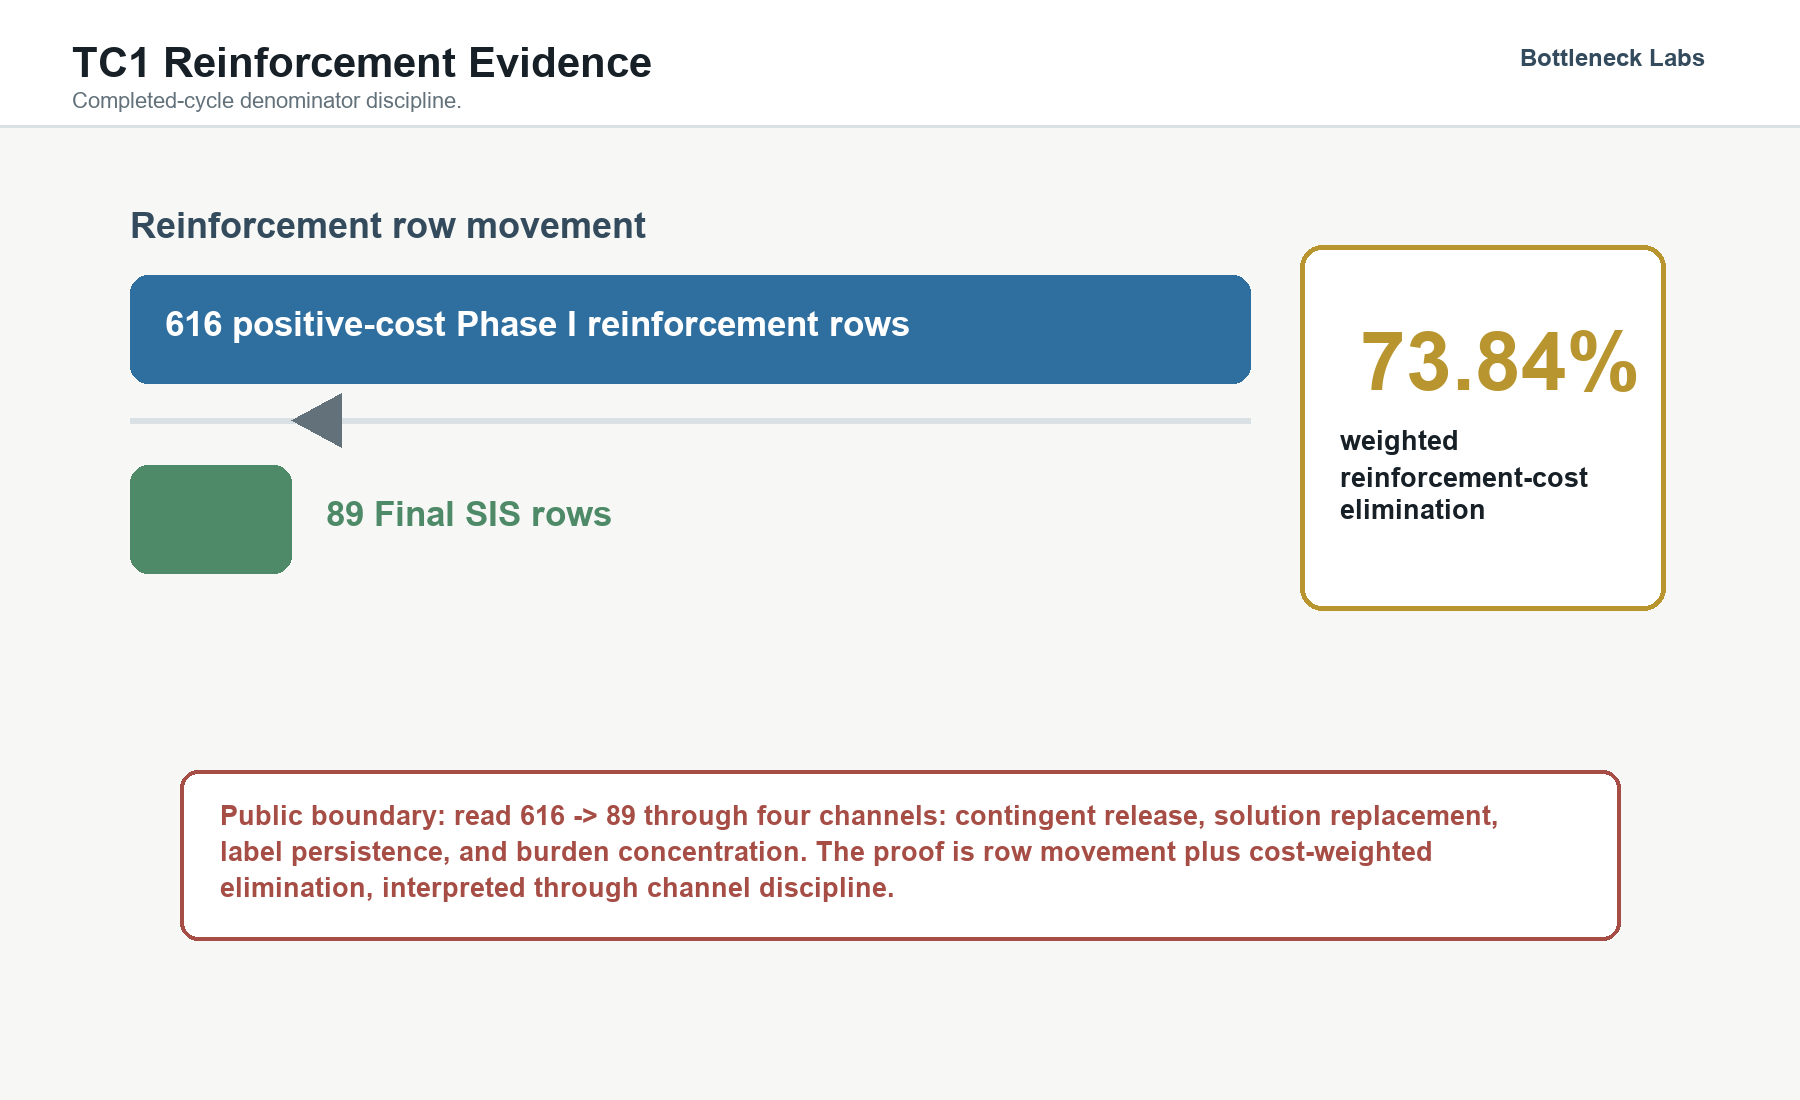
TC1 supplies the completed-cycle evidence. In that cycle, PJM studied 306 Phase I projects and retained 83 projects in the Final System Impact Study universe. The reinforcement record moved even more sharply. TC1 began with 616 positive-cost Phase I reinforcement rows and ended with 89 reinforcement rows in the final workbook.
Capital is already at risk before the project knows the answer. A Phase I cost letter can drive deposits and financing work. It can also shape lender diligence, offtake timing, and site-development decisions during the period when the shared upgrade stack is still provisional. The developer may be paying to keep an option alive before it knows whether the relevant constraint leaves the cost stack or remains with a different allocation.
Our reconciled, cost-weighted TC1 calculation shows that 73.84% of the Phase I reinforcement-cost burden moved out of the final reinforcement-cost stack on the defended basis used in the proof report. The number is the completed-cycle version of the same risk AH1-695 is just beginning to show. It turns the Crane warning from a live case into a measured cohort problem.
| TC1 movement channel | What can happen between Phase I and Final SIS | Diligence implication |
|---|---|---|
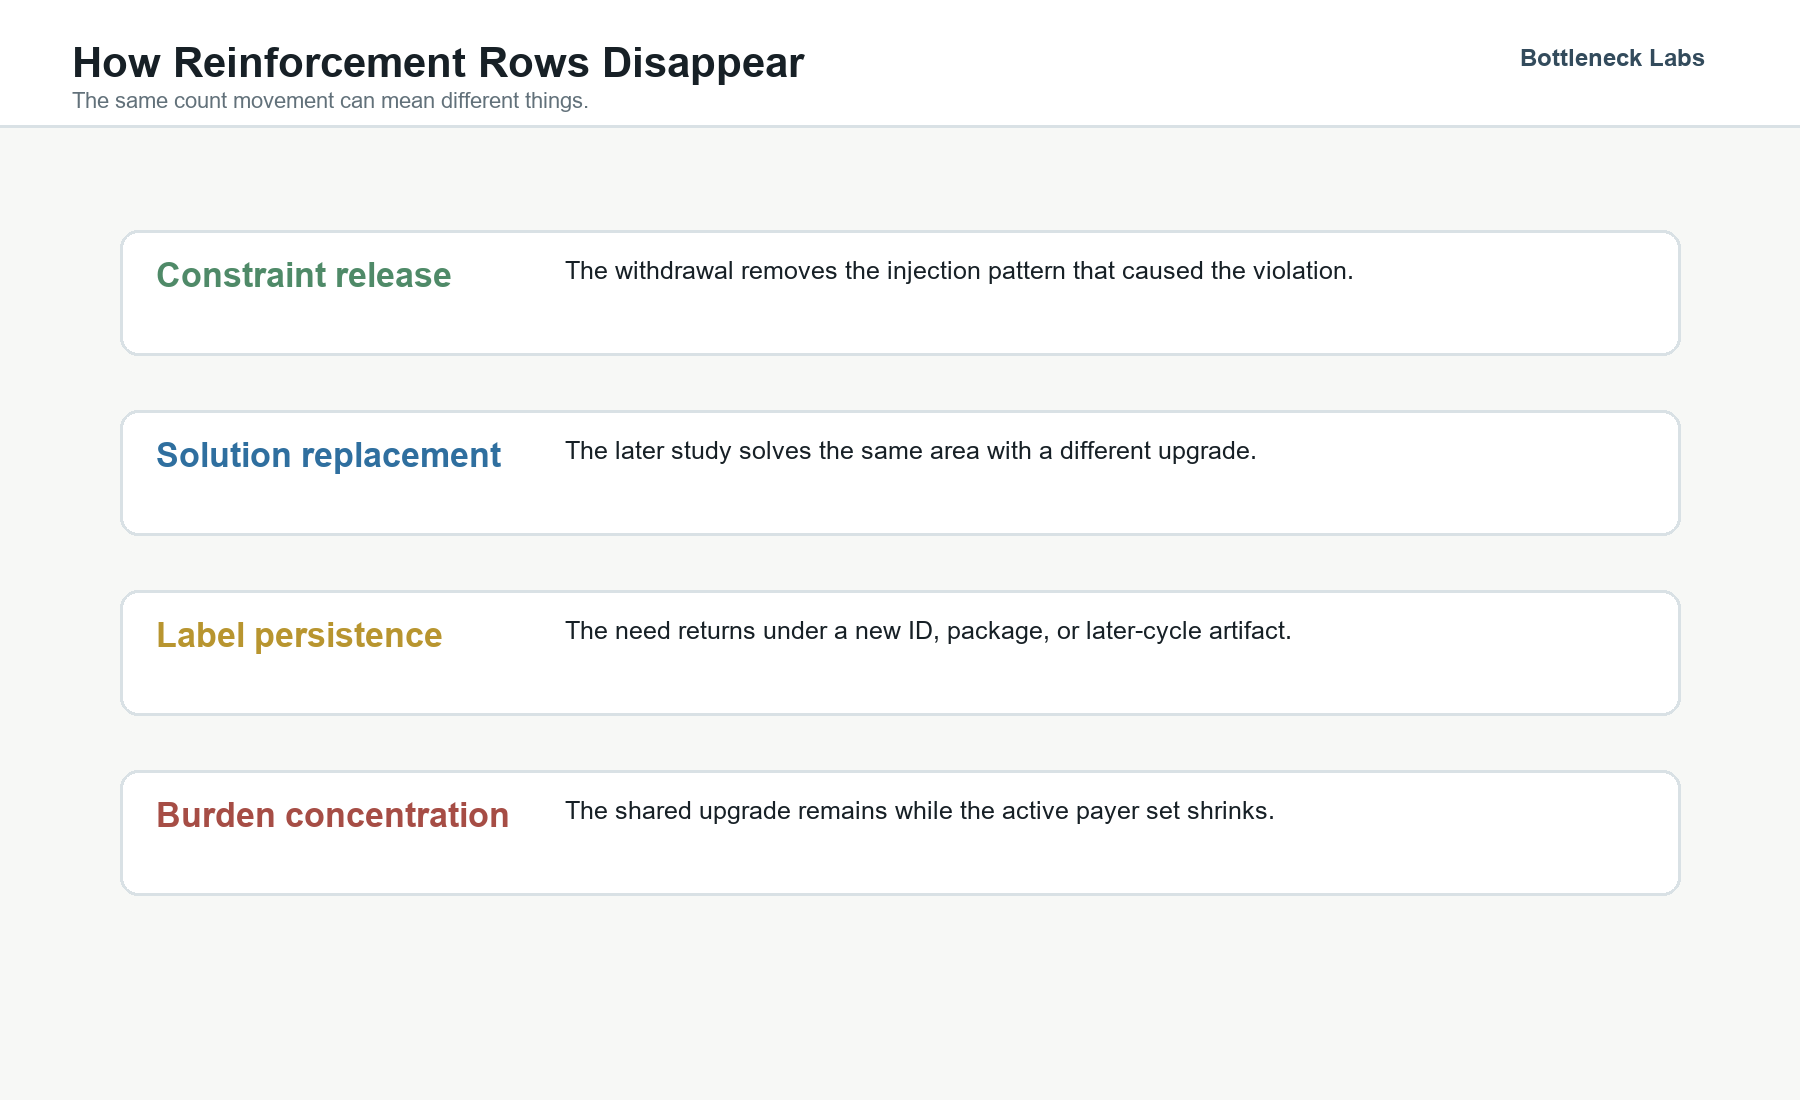
| Constraint release | Enough neighbors withdraw that a modeled overload no longer requires the same upgrade | Early shared-cost exposure can vanish because the cohort changed. |
| Solution replacement | The violation remains as the engineered fix changes when facility-level detail arrives | The first cost letter can point to the right problem and the wrong final bill. |
| Label persistence | The same physical family returns under a new label, package, or study object | A disappearing row can leave the grid need intact. |
| Burden concentration | The project survives after fewer neighbors remain to share the obligation | Surviving can increase the economic exposure even as the project clears study gates. |
In practical terms, a financing memo built on the early cost letter was underwriting a moving object. The diligence question is which movement channel the project is actually exposed to. The answer changes how much weight to put on Phase I dollars, later status records, and the next PJM study artifact.
That completed-cycle movement tells the buyer how to treat a live Phase I result. The first cost letter creates a deposit obligation and points to the binding network area. Later studies can still change the cost and solution, so the investment case has to keep the artifact open.
Crane gives the AI-power story a concrete grid object. TC1 supplies the completed-cycle warning about how early reinforcement rows move. That is the bridge into TC2. New records can score specific points of interconnection and corridors as they arrive. Upgrade families and PJM artifacts can be scored separately.
The Diligence File
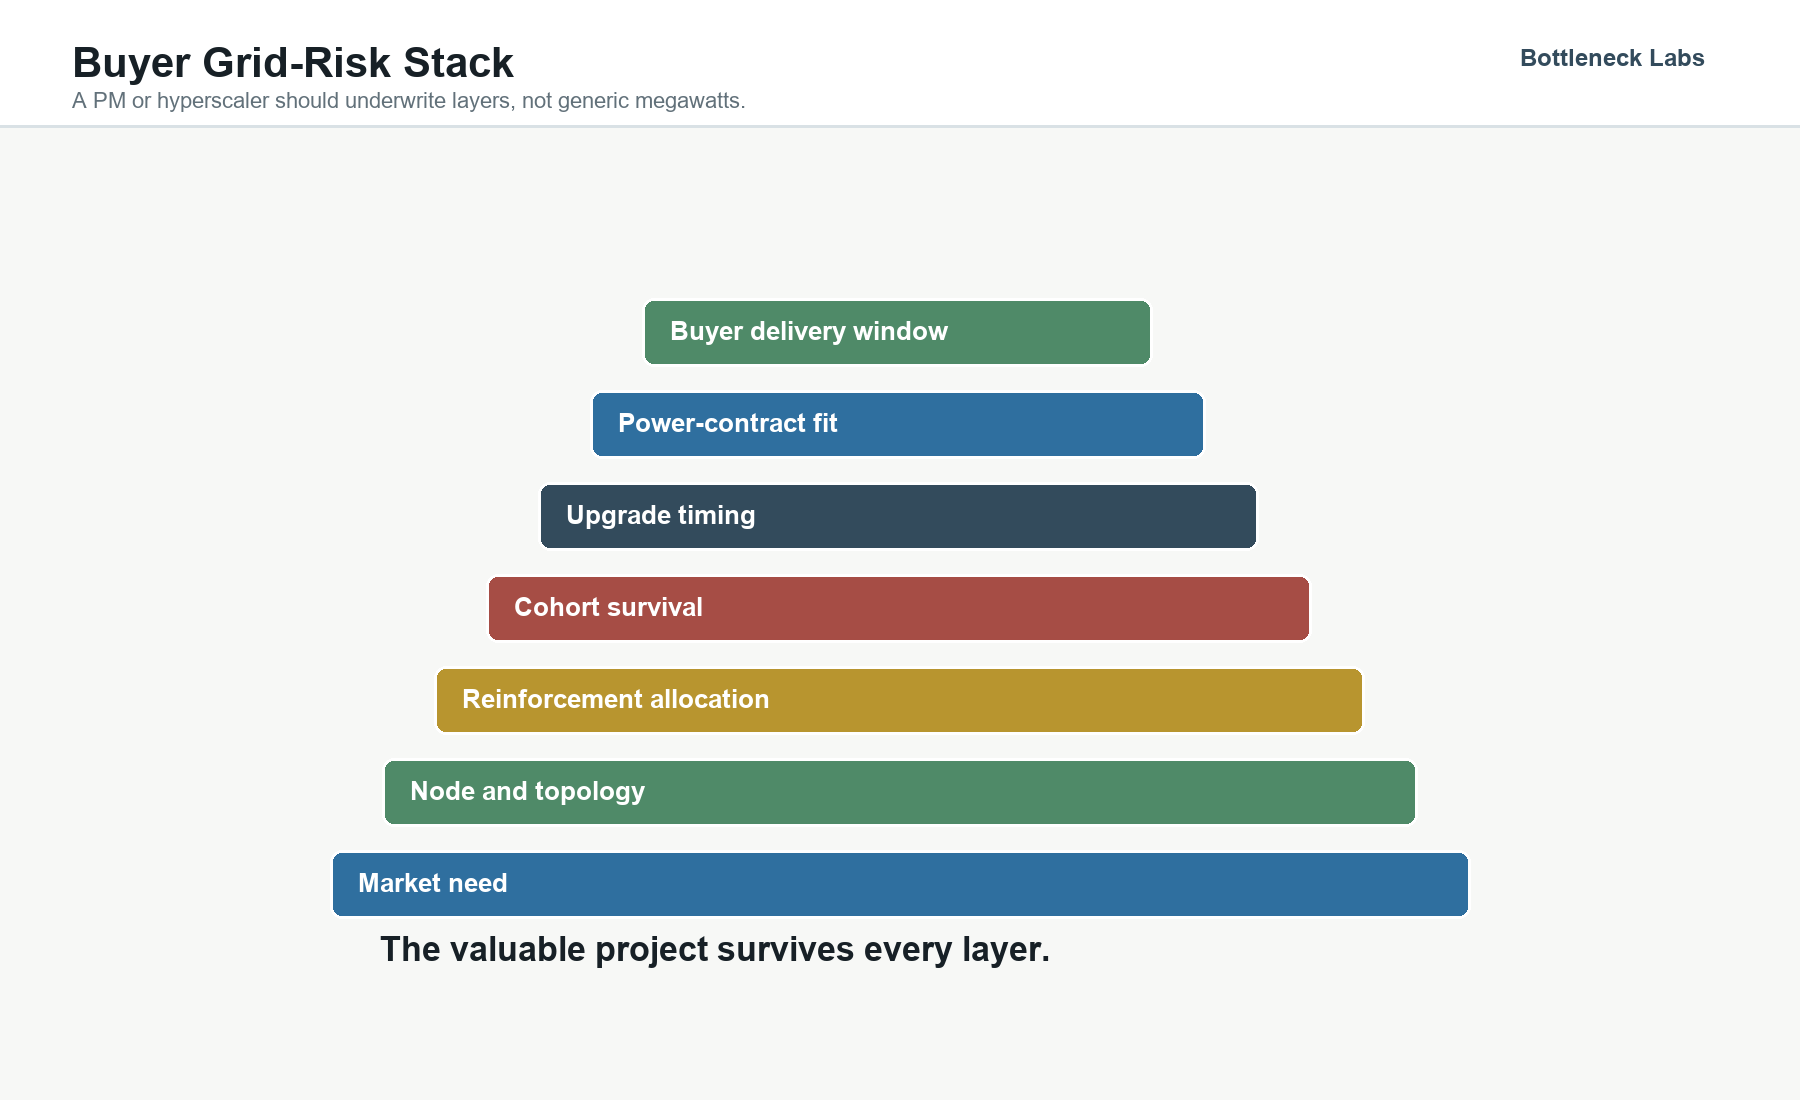
Start the buyer memo with the clock. A data-center campus, an industrial load, or a portfolio mandate needs power in a place and by a date. PJM's capacity auction can explain why scarce power has become more valuable. The project-level deliverability answer comes from the study record.
The next layer is the interconnection record. The file should identify the point of interconnection and the injection amount. It should identify the transmission owner, monitored facilities, and network upgrades. It should also show the longest construction schedule and the next PJM artifact that can revise the answer. A project with an attractive PPA can still fail the buyer's calendar if the binding grid work sits outside the delivery window.
Cohort survival matters when the cost is shared. If neighboring projects withdraw, they can remove the modeled violation, shift the solution, or leave a surviving project with a different economic exposure. That is why a live TC2 object and a completed TC1 postmortem belong in the same diligence workflow even when they do different jobs.
The memo should end as a deliverability read built around three questions about which point of interconnection controls the case, which network upgrade sets the longest schedule, and which later PJM artifact can revise the conclusion. The clock remains the buyer-facing test. Once those fields are visible, a procurement story becomes an exposure map.
What Would Change The Claim
The Crane read gets weaker if later PJM materials show AH1-695 can achieve full deliverability without the long-dated 500 kV reinforcement family, or if FERC/PJM treatment creates a path that cleanly separates restart timing from the contested network upgrades. It also weakens if later TC2 records show long-lead shared upgrades disappearing cleanly without burden concentration on the surviving projects. That outcome would show the Phase I clock as a temporary warning signal, with durability left unproven.
The read gets stronger if AH1-695 keeps a late-2030 or 2031 deliverability dependency, if the listed 500 kV upgrade family persists under a successor label, or if interim-deliverability language becomes central to the restart path. It also strengthens if TC2 projects tied to long-dated shared upgrades withdraw at a visibly higher rate than projects with only local or shorter-lead work. That pattern would show the schedule risk moving from one public power story into a broader cohort.
The claim has to stay testable. AI power strategy begins with who can sign for megawatts. The harder question is which resources can pass PJM's grid test on the buyer's clock.
Scoreable Predictions
The following predictions keep the argument tied to source objects. Each one states a denominator and a future artifact that can prove or break it. Later PJM and FERC records should make the claim scoreable as new source objects arrive.
Prediction card 1. AH1-695 deliverability dependency.
Claim. A later PJM Phase II, Phase III, Generator Interconnection Agreement, interim-deliverability, RTEP, or related PJM/FERC artifact for AH1-695 / Three Mile Island 230 kV will preserve a material deliverability dependency on the High Ridge / North Delta 500 kV family, a traceable successor to that family, or an interim-deliverability limitation tied to the same physical need with a 2030-or-later schedule implication.
Denominator. Later public PJM or FERC artifacts that specifically cover AH1-695, the Three Mile Island 230 kV nuclear request, or the network-upgrade family identified in the AH1-695 Phase I record.
Pass. A later artifact links AH1-695 or the Three Mile Island 230 kV request to the High Ridge / North Delta 500 kV family, an identified successor 500 kV upgrade with comparable physical scope, or an interim-deliverability limitation tied to the same need.
Fail. Later artifacts covering the request show full deliverability without the listed or successor 500 kV reinforcement family and without a 2030-or-later schedule implication.
Why this is the right test. The prediction keeps the public AI-power story attached to the actual study object, then grades whether the network clock remains visible after the commercial story enters PJM's later study process.
Prediction card 2. Long-lead upgrade attrition.
Claim. In TC2, projects assigned to shared network upgrades with a posted construction horizon of 72 months or longer, or a projected in-service date in 2030 or later, will withdraw at a higher rate than projects assigned only local or shorter-lead network work.
Denominator. TC2 projects grouped by denominator-labeled upgrade exposure after Phase II and final study artifacts post.
Pass. The long-lead shared-upgrade cohort has a withdrawal rate at least 10 percentage points higher than the local or shorter-lead comparison cohort.
Fail. The spread is below 10 percentage points or reverses.
Why this is the right test. A project assigned only local interconnection work is mainly underwriting its own path to the grid. A project assigned to shared long-lead network work is exposed to the neighbor set and to a construction clock that can exceed a buyer's delivery window.
Methodology And Sources
The Crane/Microsoft commercial facts come from Constellation's September 20, 2024 announcement of a 20-year power purchase agreement with Microsoft. The same announcement covers the planned restart of Three Mile Island Unit 1 as Crane Clean Energy Center. It also says Microsoft would use the agreement to help match power used by its PJM data centers with carbon-free energy. Constellation's February 19, 2025 update supplies the statement that it had filed an interconnection request with PJM for Crane's 835 MW. Constellation's June 25, 2025 update supplies the early-2027 restart language and the statement that PJM had approved an expedited interconnection request.
The PJM grid-study object is PJM's AH1-695 Phase I study report for a Constellation Energy Generation nuclear request at Three Mile Island 230 kV. The report supplies the 859 MW energy / 803 MW capacity evaluation and the Decision Point I readiness-deposit calculation. It supplies the 24-month physical interconnection schedule after Generator Interconnection Agreement and construction kickoff. It also says network-impact reinforcement schedules will be more clearly identified in Phase II and Phase III. The costed system-reinforcement table allocates $62.05 million and $29.83 million to two singleton ME 230 kV rebuild rows and $137,130 to AH1-695 on a shared APS wave-trap row. The long-clock deliverability read comes from the High Ridge / North Delta 500 kV contingent rows with 2030 projected dates and interim-deliverability language. Bottleneck Labs' local AH1-695 row packet is used only as extraction support tied to that PJM source page.
PJM capacity-market figures come from PJM's 2027/2028 Base Residual Auction announcement. That source provides the $333.44 per MW-day price and the 134,479 MW of UCAP procured in the auction. It also provides the 11,299 MW of FRR UCAP and the 145,777 MW combined figure. The same announcement gives the 6,623 MW shortfall against the reliability requirement. It says nearly 5,100 MW of the 5,250 MW forecast-load increase came from data-center demand. The auction numbers are used for system pressure only.
PJM's April 29, 2026 Cycle 1 announcement supplies the new-queue context. The relevant figures are 811 submitted projects and 220 GW of nameplate capability. The announcement also describes validation of technical and financial information. It ties demand growth largely to data centers and warns that demand growth is outpacing new supply. The Cycle 1 material is used to show development interest entering the filter; buildout claims require later project records.
TC1 project and reinforcement claims come from our reconciliation of PJM TC1 study workbooks and project-status records. The denominator is 616 positive-cost Phase I reinforcement rows and 89 Final System Impact Study reinforcement rows. The 73.84% cost-weighted movement is interpreted through four channels. The first two are contingent constraint release and solution replacement. The second two are label persistence and burden concentration.
Interconnection-policy context comes from FERC's Generator Interconnection page and the FERC Order 2023 explainer. It also uses PJM Manual 14H and PJM's New Service Request Deposits page. Source links for the main empirical objects include PJM's 2027/2028 capacity-auction announcement and PJM's April 2026 Cycle 1 announcement. The Crane source set includes Constellation's Crane launch announcement, Constellation's February 2025 Crane update, and Constellation's June 2025 Crane update. PJM's AH1-695 Phase I study report supplies the project study record. The source list is limited to documents used in the release body or method boundary.